Figure 3. Correlation analysis showing that the serum MMP2 concentrations were positively correlated with serum MMP9 concentrations
in the PCV group (r=0.822, p<0.001). Pearson’s correlation test was used (p<0.05 significance; r=correlation coefficient).
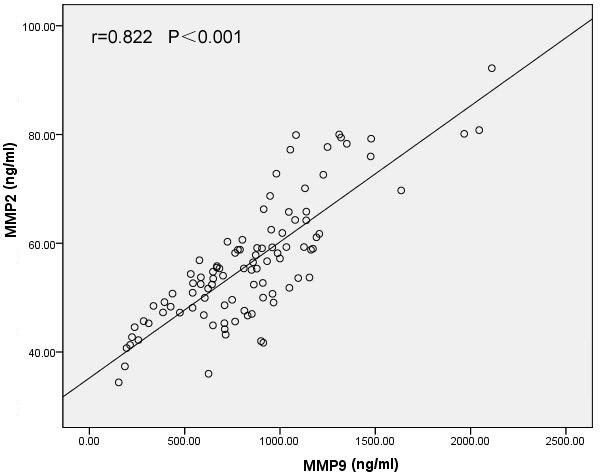
 Figure 3 of
Zeng, Mol Vis 2013; 19:729-736.
Figure 3 of
Zeng, Mol Vis 2013; 19:729-736.