Figure 7. Summary schematic of secretion profiles from RPE under different stimulations: HQ, passage- related senescence, and AGEs.
Secreted profiles included various cytokines/growth factors involved in angiogenesis and inflammation. The change is indicated
by arrows: an up arrow for an increase and a down arrow for a decrease.
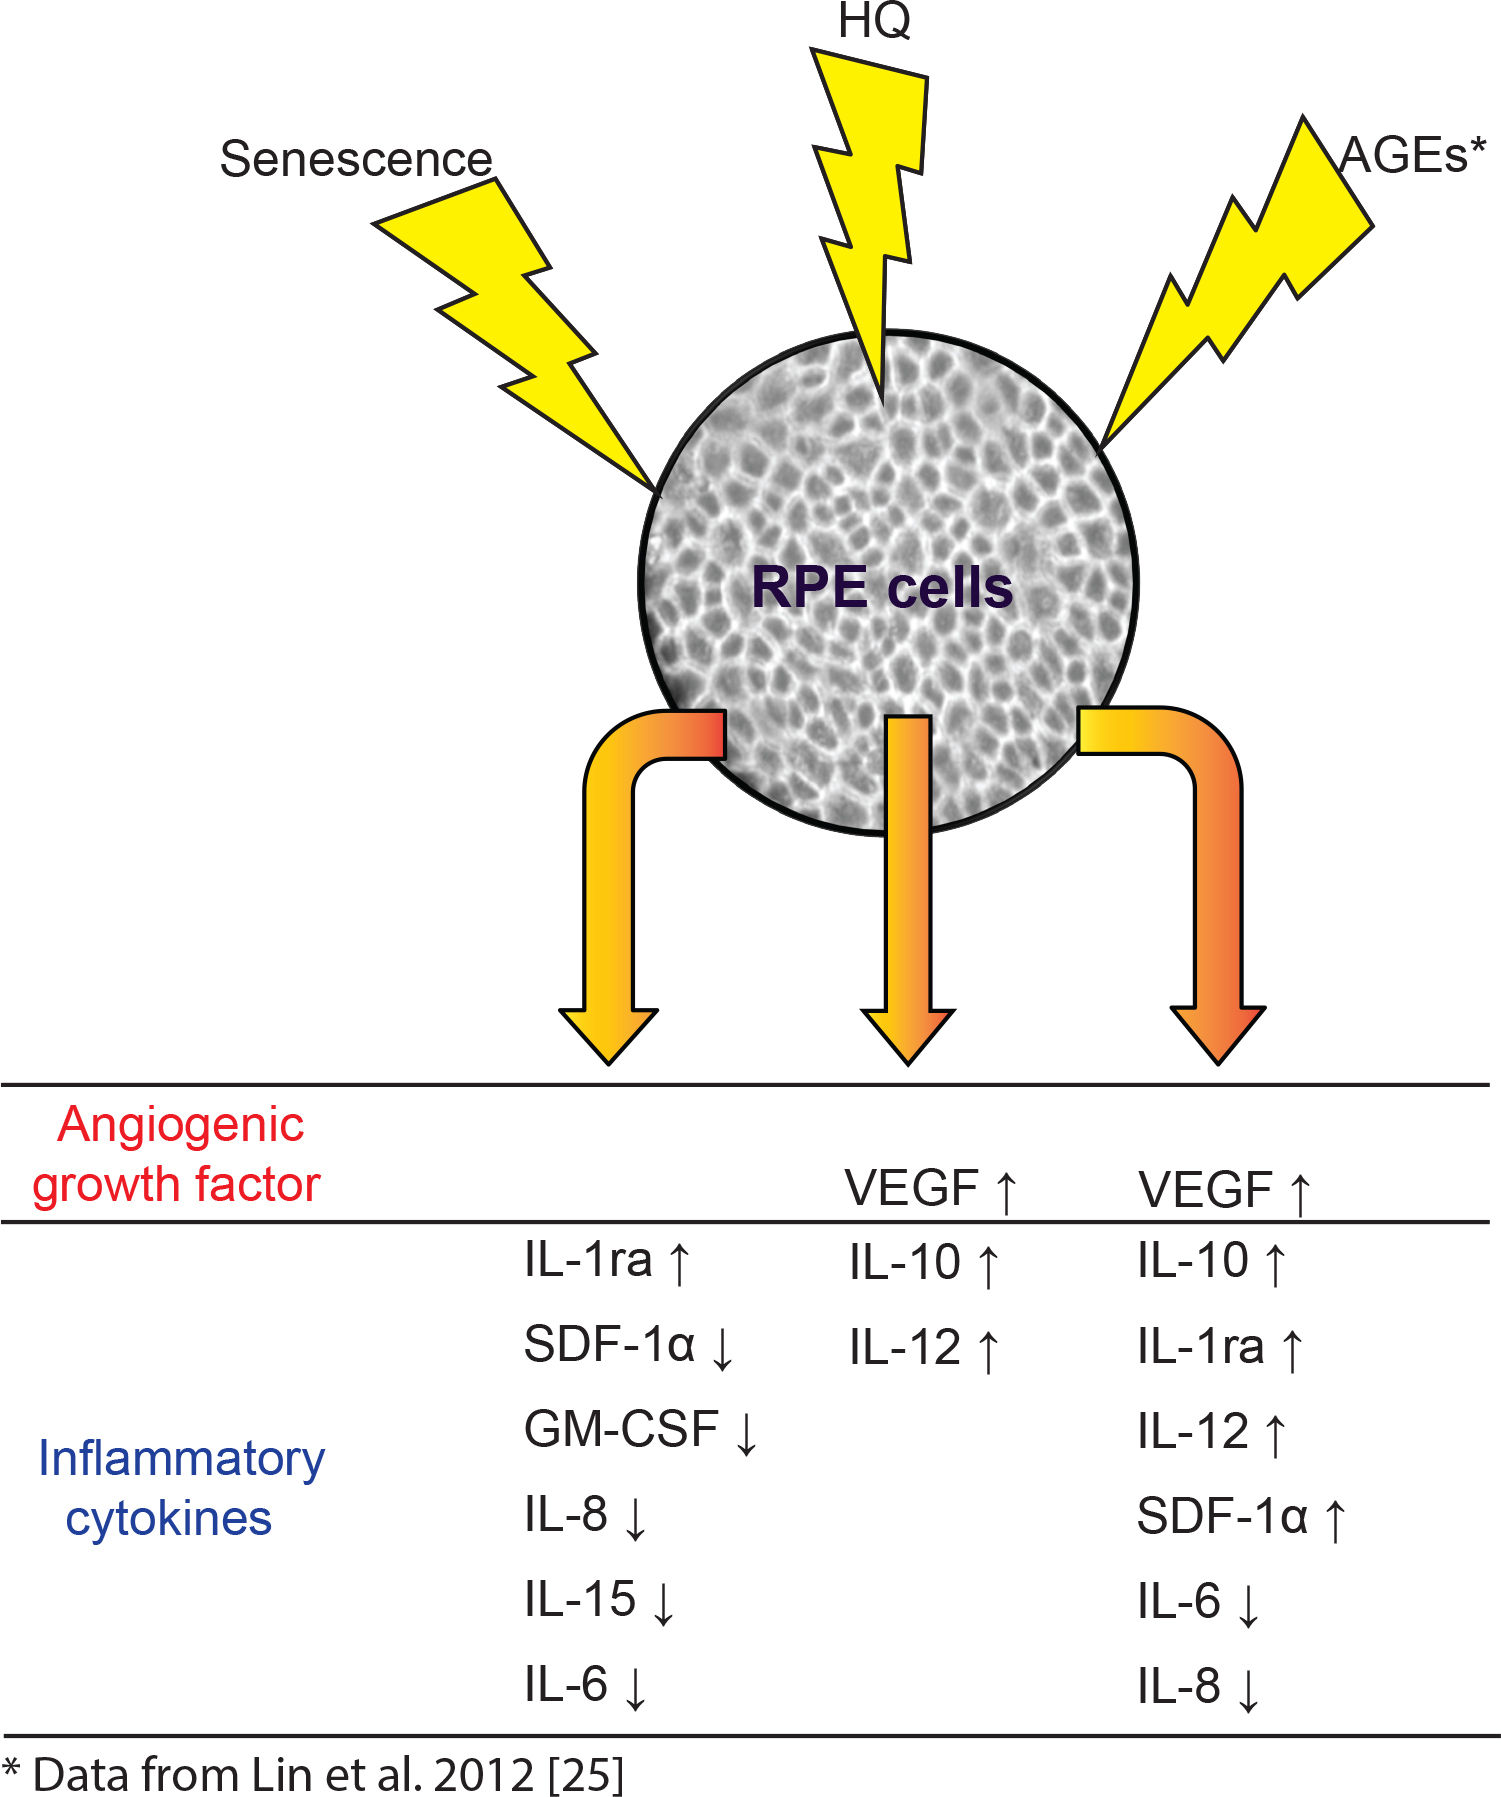
 Figure 7 of
Cao, Mol Vis 2013; 19:718-728.
Figure 7 of
Cao, Mol Vis 2013; 19:718-728.