Figure 3. Family segregation of RHO (on the right) and PRPF31 mutations (on the left). A: Pedigrees of families carrying mutations in RHO (p.Asn73del) and PRPF31 (p.Ile109del). B: Pyrosequencing chromatogram of the mutations p.Asn73del and p.Ile109del. The top plots are idealized flowgrams for the selected
reference sequences and the bottom plots are the aligned flowgrams for the selected reads. Each bar represents the signal
intensity for each nucleotide and its height corresponds to the number of nucleotides. The deletion sequence is shown when
comparing both flowgrams (shadowed region).
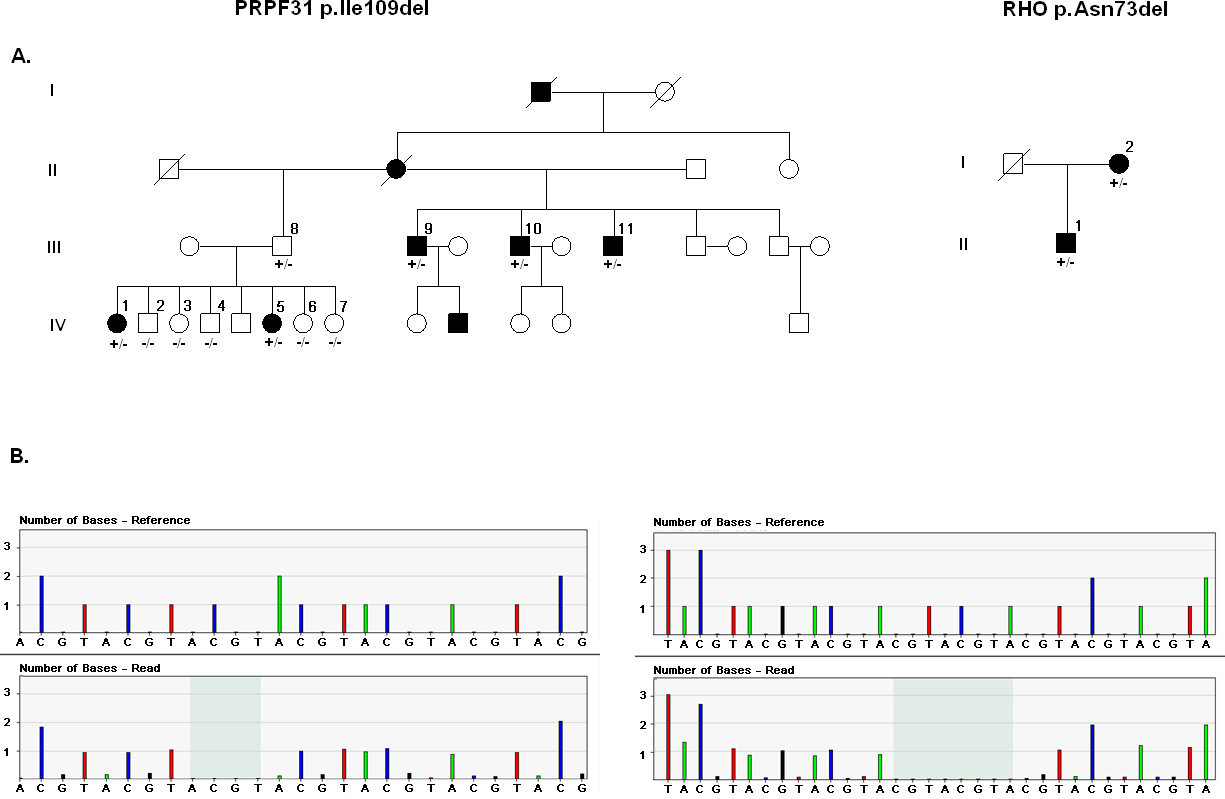
 Figure 3 of
Dias, Mol Vis 2013; 19:654-664.
Figure 3 of
Dias, Mol Vis 2013; 19:654-664.