Figure 2 of
Dias, Mol Vis 2013; 19:654-664.
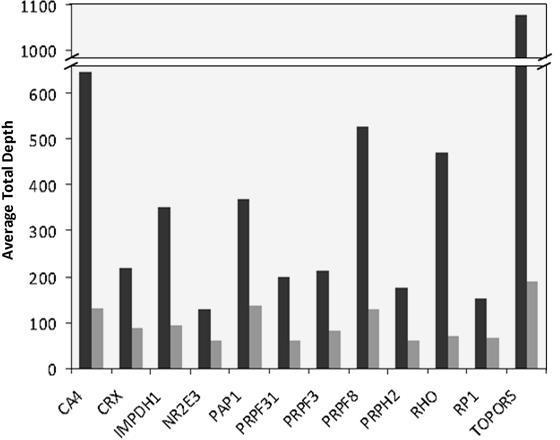
Figure 2.
Average total depth for each of the 12 analyzed genes for one sample/PicoPlate (black) and four samples/PicoPlate (gray).
 Figure 2 of
Dias, Mol Vis 2013; 19:654-664. Figure 2 of
Dias, Mol Vis 2013; 19:654-664.
Figure 2 of
Dias, Mol Vis 2013; 19:654-664. Figure 2 of
Dias, Mol Vis 2013; 19:654-664.