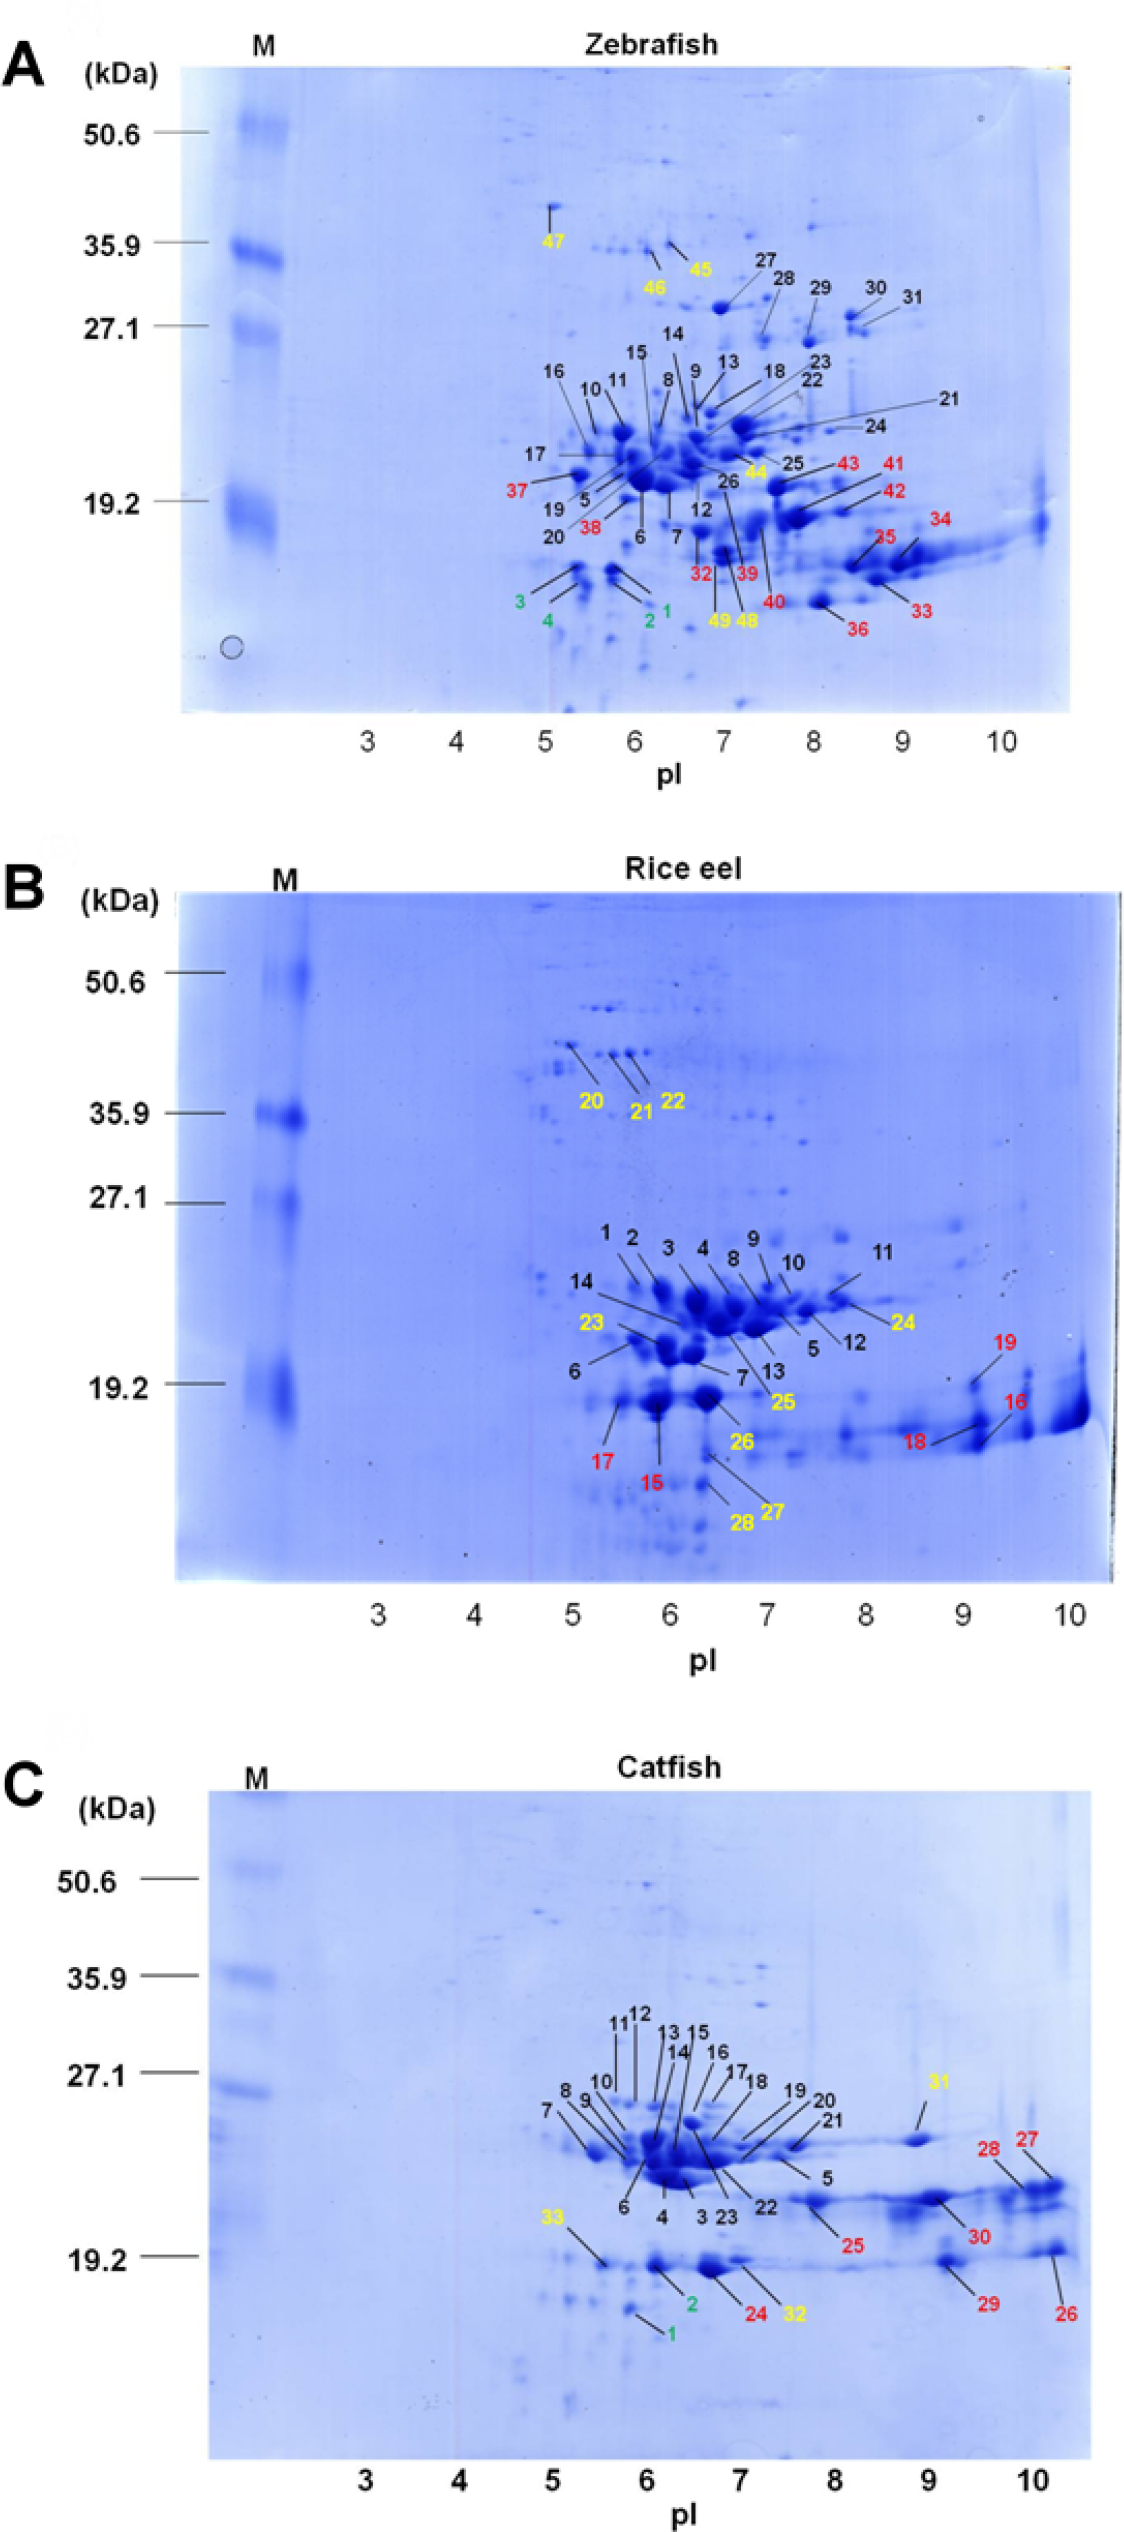
Figure 5. Two-dimensional gel patterns of piscine lens proteins. (
A) Zebrafish, (
B) rice eel, and (
C) catfish. Total protein (200 μg) in each sample was loaded onto immobilized pH gradient (IPG) gel strips (pH 3–10 Nonlinear,
13 cm). The procedures were as described previously [
34]. After electrophoresis, the gels were fixed in 40% methanol and 10% acetic acid and stained by Coomassie blue G-250. The
IPG strips were rehydrated, and after isoelectric focusing (IEF), subjected to two-dimensional (2D) electrophoresis. Protein
spots marked with numbers were further identified by nano LC-MS/MS and listed in
Table 2. The result is representative of three independent 2D experiments for each fish species. Identified crystallins by proteomic
analysis were denoted by green (α-crystallin), black (β-crystallin), red (γ-crystallin), and yellow (noncrystallin proteins).
 Figure 5 of
Lin, Mol Vis 2013; 19:623-637.
Figure 5 of
Lin, Mol Vis 2013; 19:623-637.