Figure 4. Comparative proteomics analysis identified lens proteins from zebrafish, rice eel, and catfish by sodium dodecyl sulfate–polyacrylamide
gel electrophoresis (SDS–PAGE) followed by nano-liquid chromatography coupled tandem mass spectrometry (nanoLC-MS/MS). In
the right panel, protein and peptide bands identified in the zebrafish databank with different expression levels are indicated
by arrows. In comparison with zebrafish lens proteome, α-crystallin proteins in the rice eel and catfish lens were found to
significantly decrease in expression levels as compared to zebrafish lens.
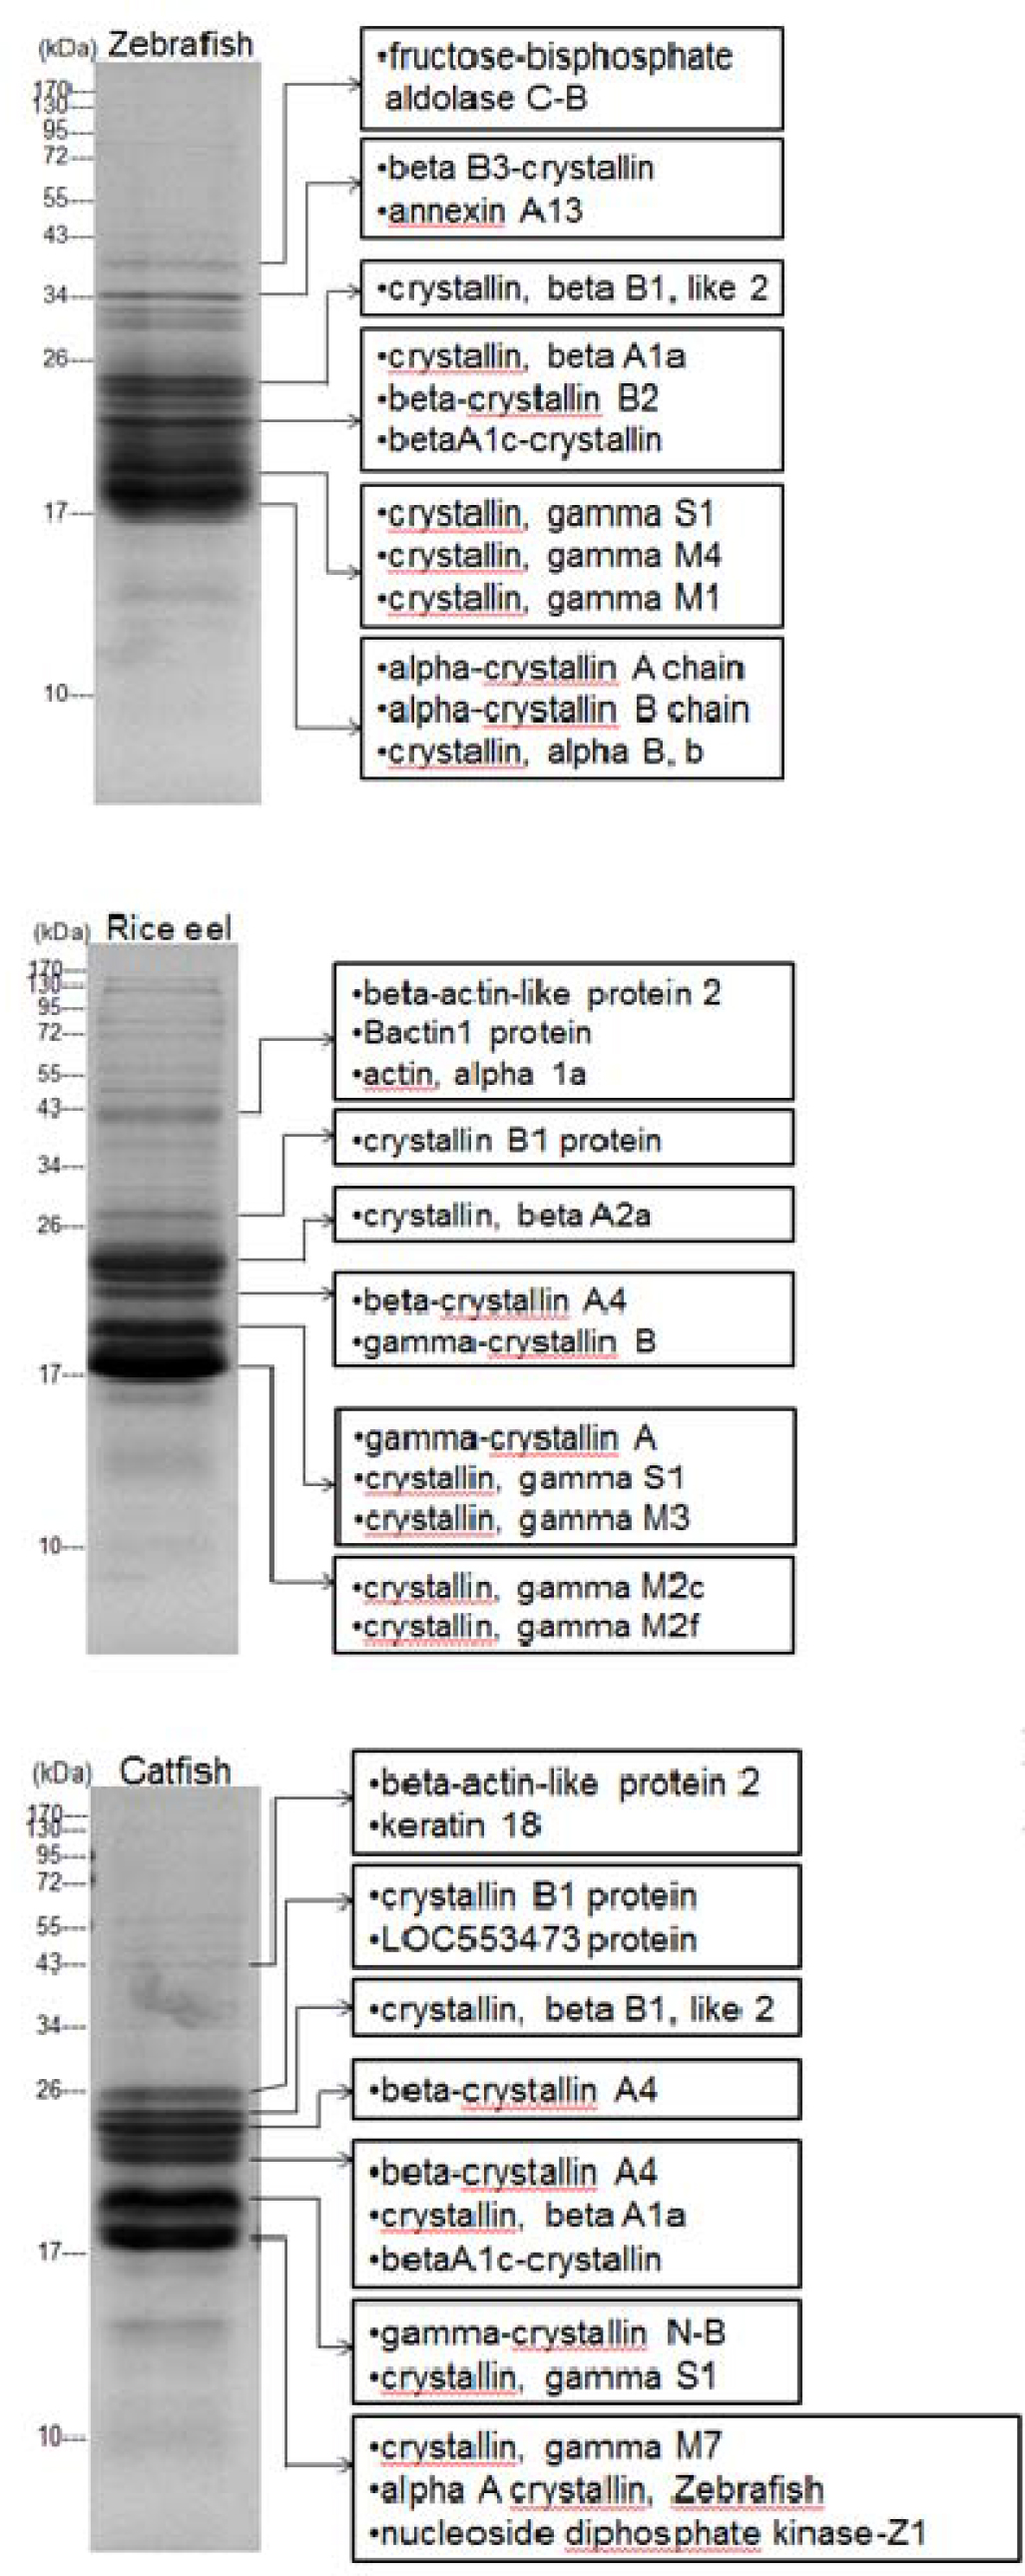
 Figure 4 of
Lin, Mol Vis 2013; 19:623-637.
Figure 4 of
Lin, Mol Vis 2013; 19:623-637.