Figure 6. Mass spectrometry images of rat optic nerve tissue. A: Matrix-assisted laser desorption ionization–imaging mass spectrometry (MALDI-IMS) image showing the distribution of PC(18:0/20:4)
at m/z 810.6 located in the meninges, connective tissue, and the wall of a blood vessel running parallel to the optic nerve
fiber. B: MALDI-IMS image of PC(18:0/18:1) at m/z 788.6 located in the optic nerve.
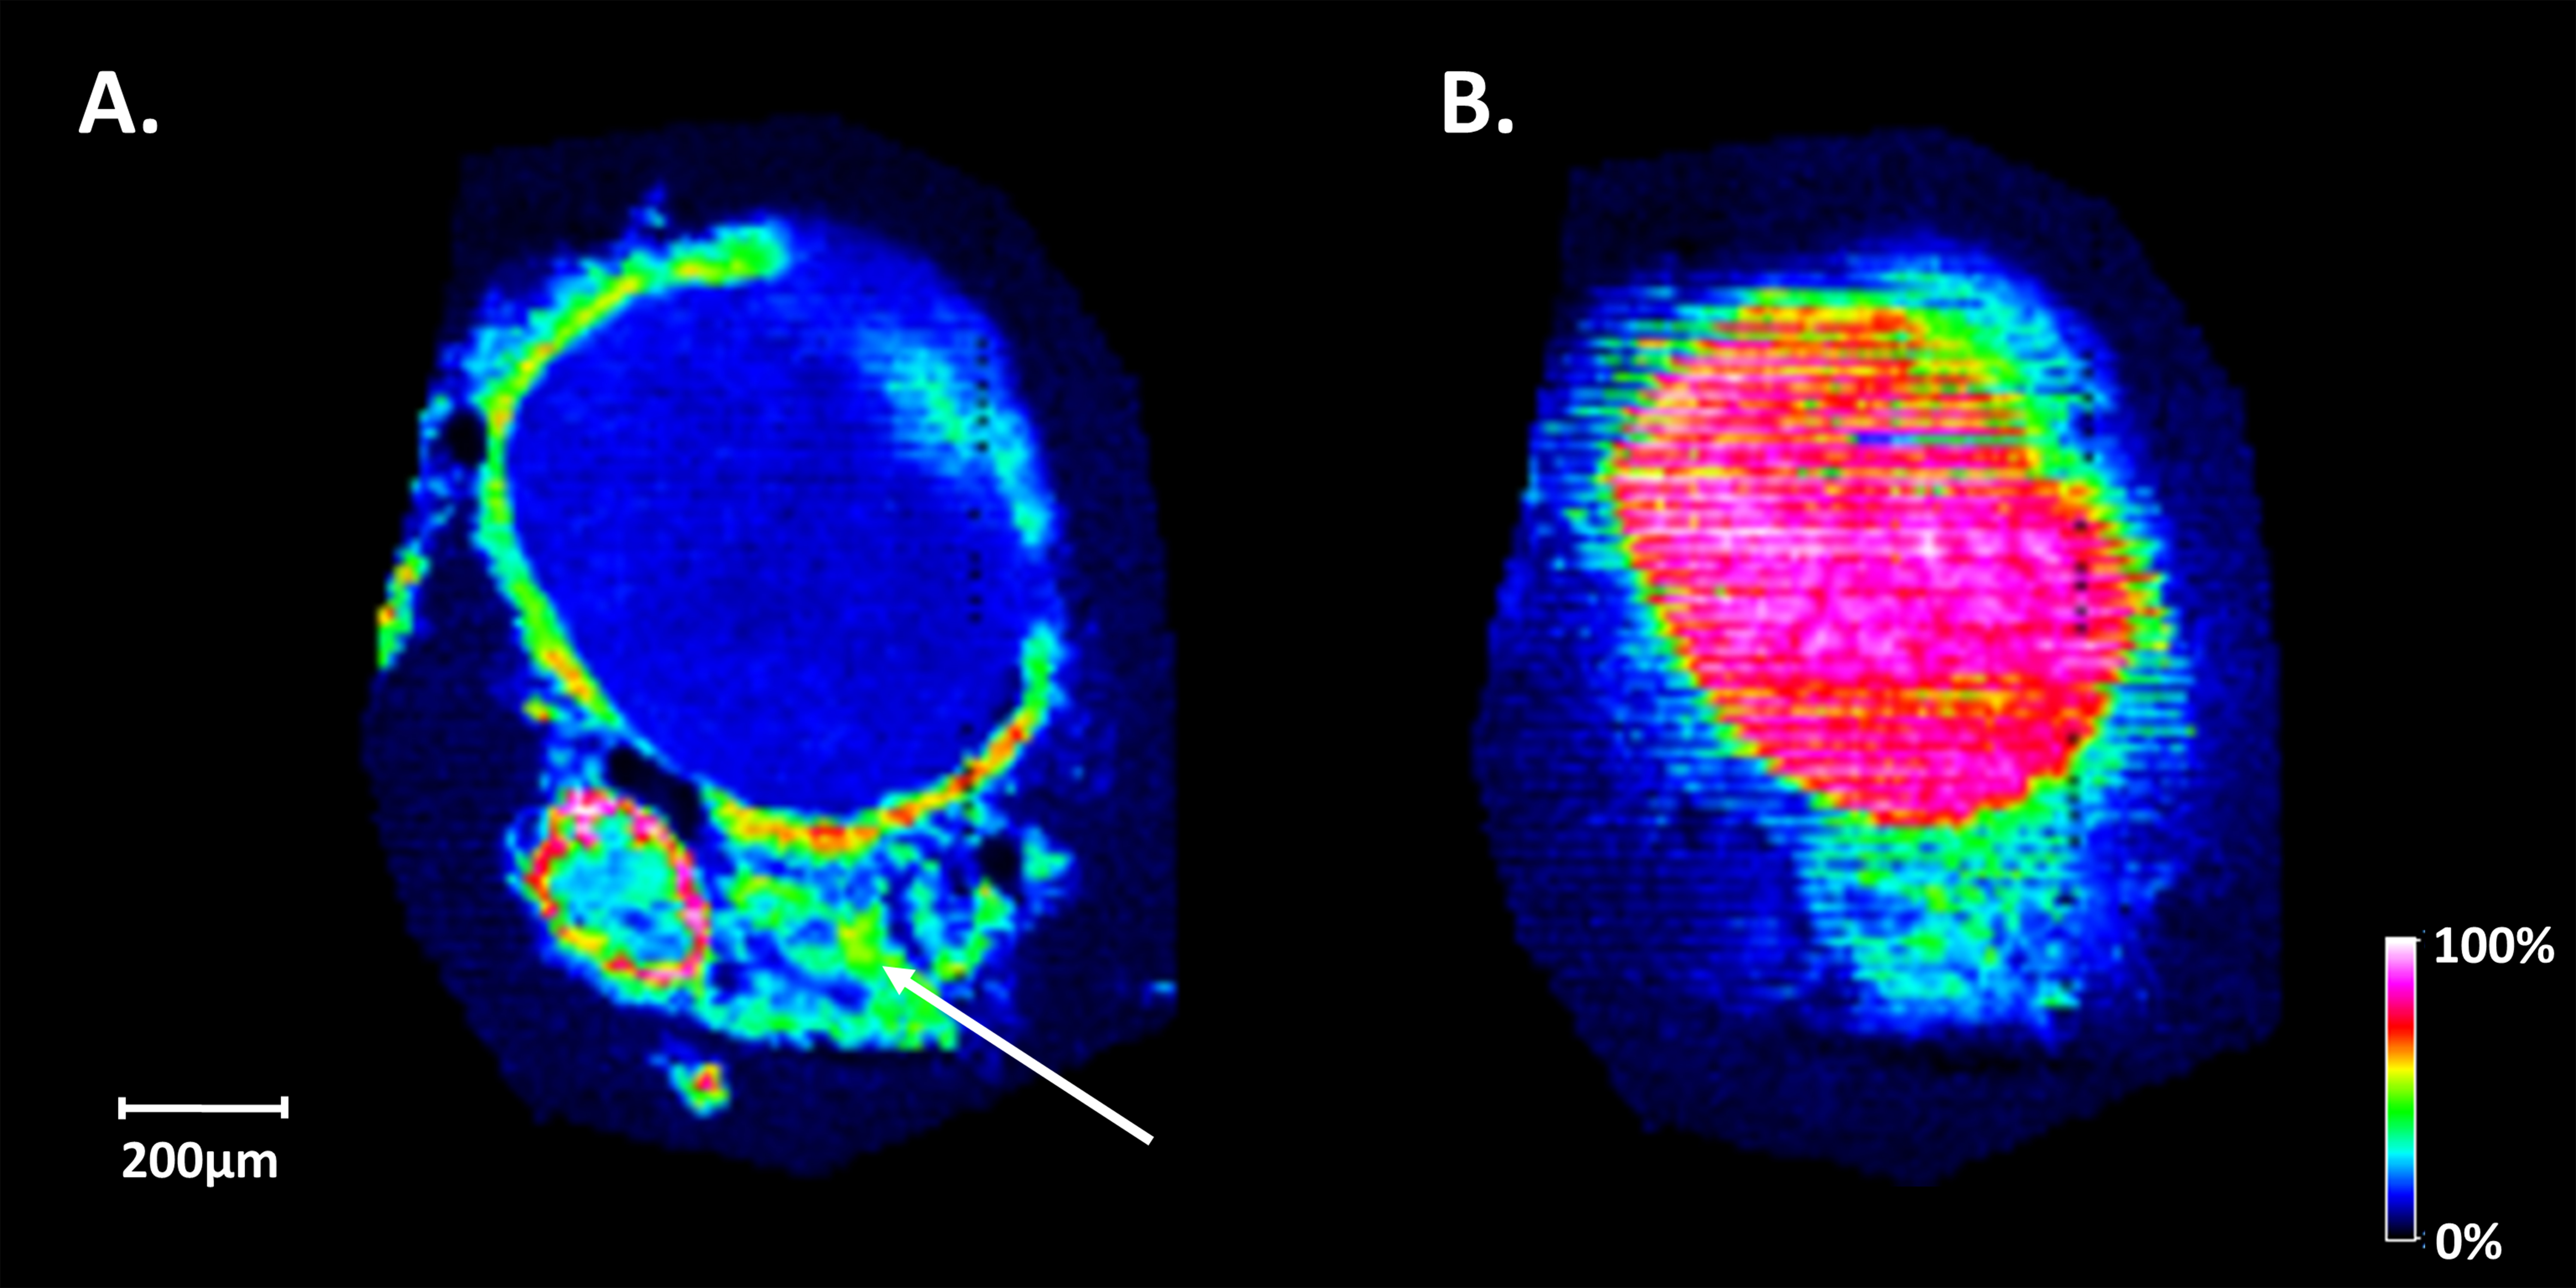
 Figure 6 of
Anderson, Mol Vis 2013; 19:581-592.
Figure 6 of
Anderson, Mol Vis 2013; 19:581-592.