Figure 4. Optical and mass spectrometry images of mouse optic nerve tissue. A: Optical image of mouse ocular tissue section coated with the 2,5-dihydroxybenzoic acid matrix. B: Matrix-assisted laser desorption ionization–imaging mass spectrometry (MALDI-IMS) image in positive ion mode at 10 µm spatial
resolution of a mouse optic nerve illustrating the distribution and intensity of a protonated phosphatidylcholine species
C44H86NO8P (PC(18:1/18:0)) at m/z 788.6. C: MALDI-IMS image illustrating the distribution and intensity of a protonated phosphatidylcholine species C40H80NO8P (PC (16:0:16:0)) at m/z 734.6.
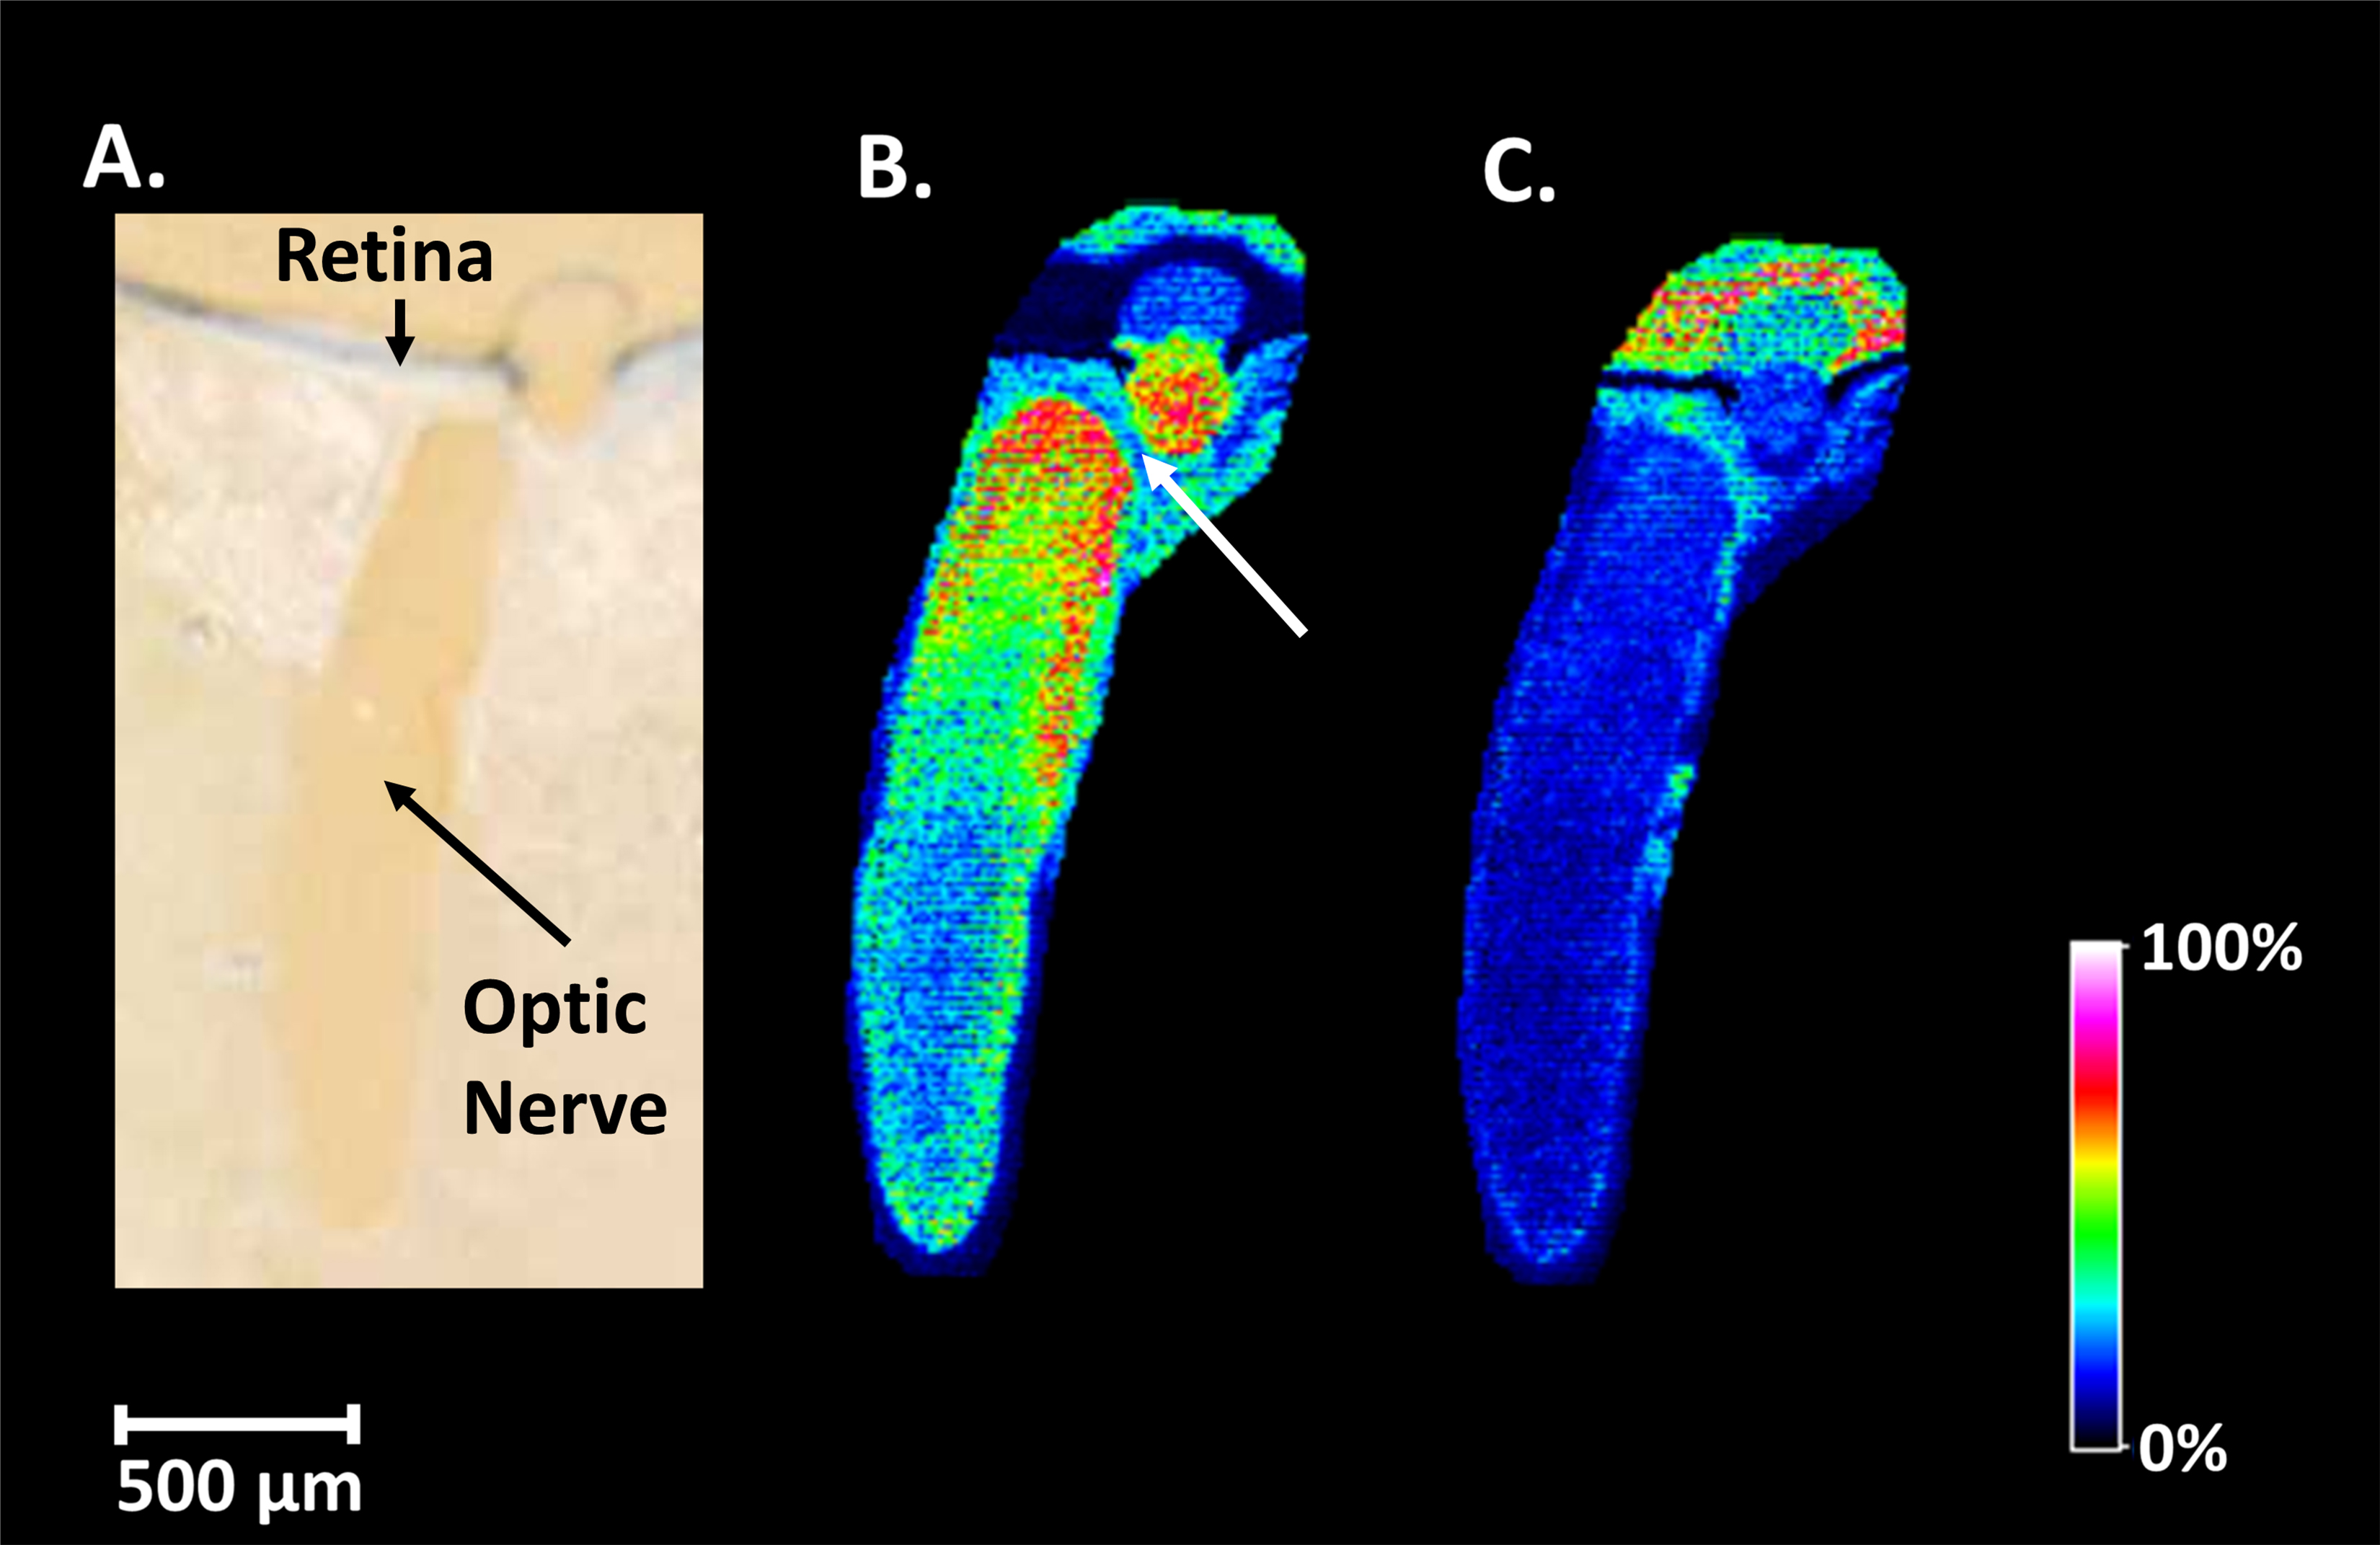
 Figure 4 of
Anderson, Mol Vis 2013; 19:581-592.
Figure 4 of
Anderson, Mol Vis 2013; 19:581-592.