Figure 3. Optical image of tissue and mass spectrometry data of major lipid at m/z 806.5 from mouse optic nerve. A: Optical image of ocular tissue section coated with the 2,5-dihydroxybenzoic acid matrix. B: Matrix-assisted laser desorption ionization–imaging mass spectrometry (MALDI-IMS) image showing the distribution of the
deprotonated sphingolipid species at m/z 806.5. C: product ion spectrum of m/z 806.5 identified as C42H80NO11S (Sulfatide (d18:1/18:0)).
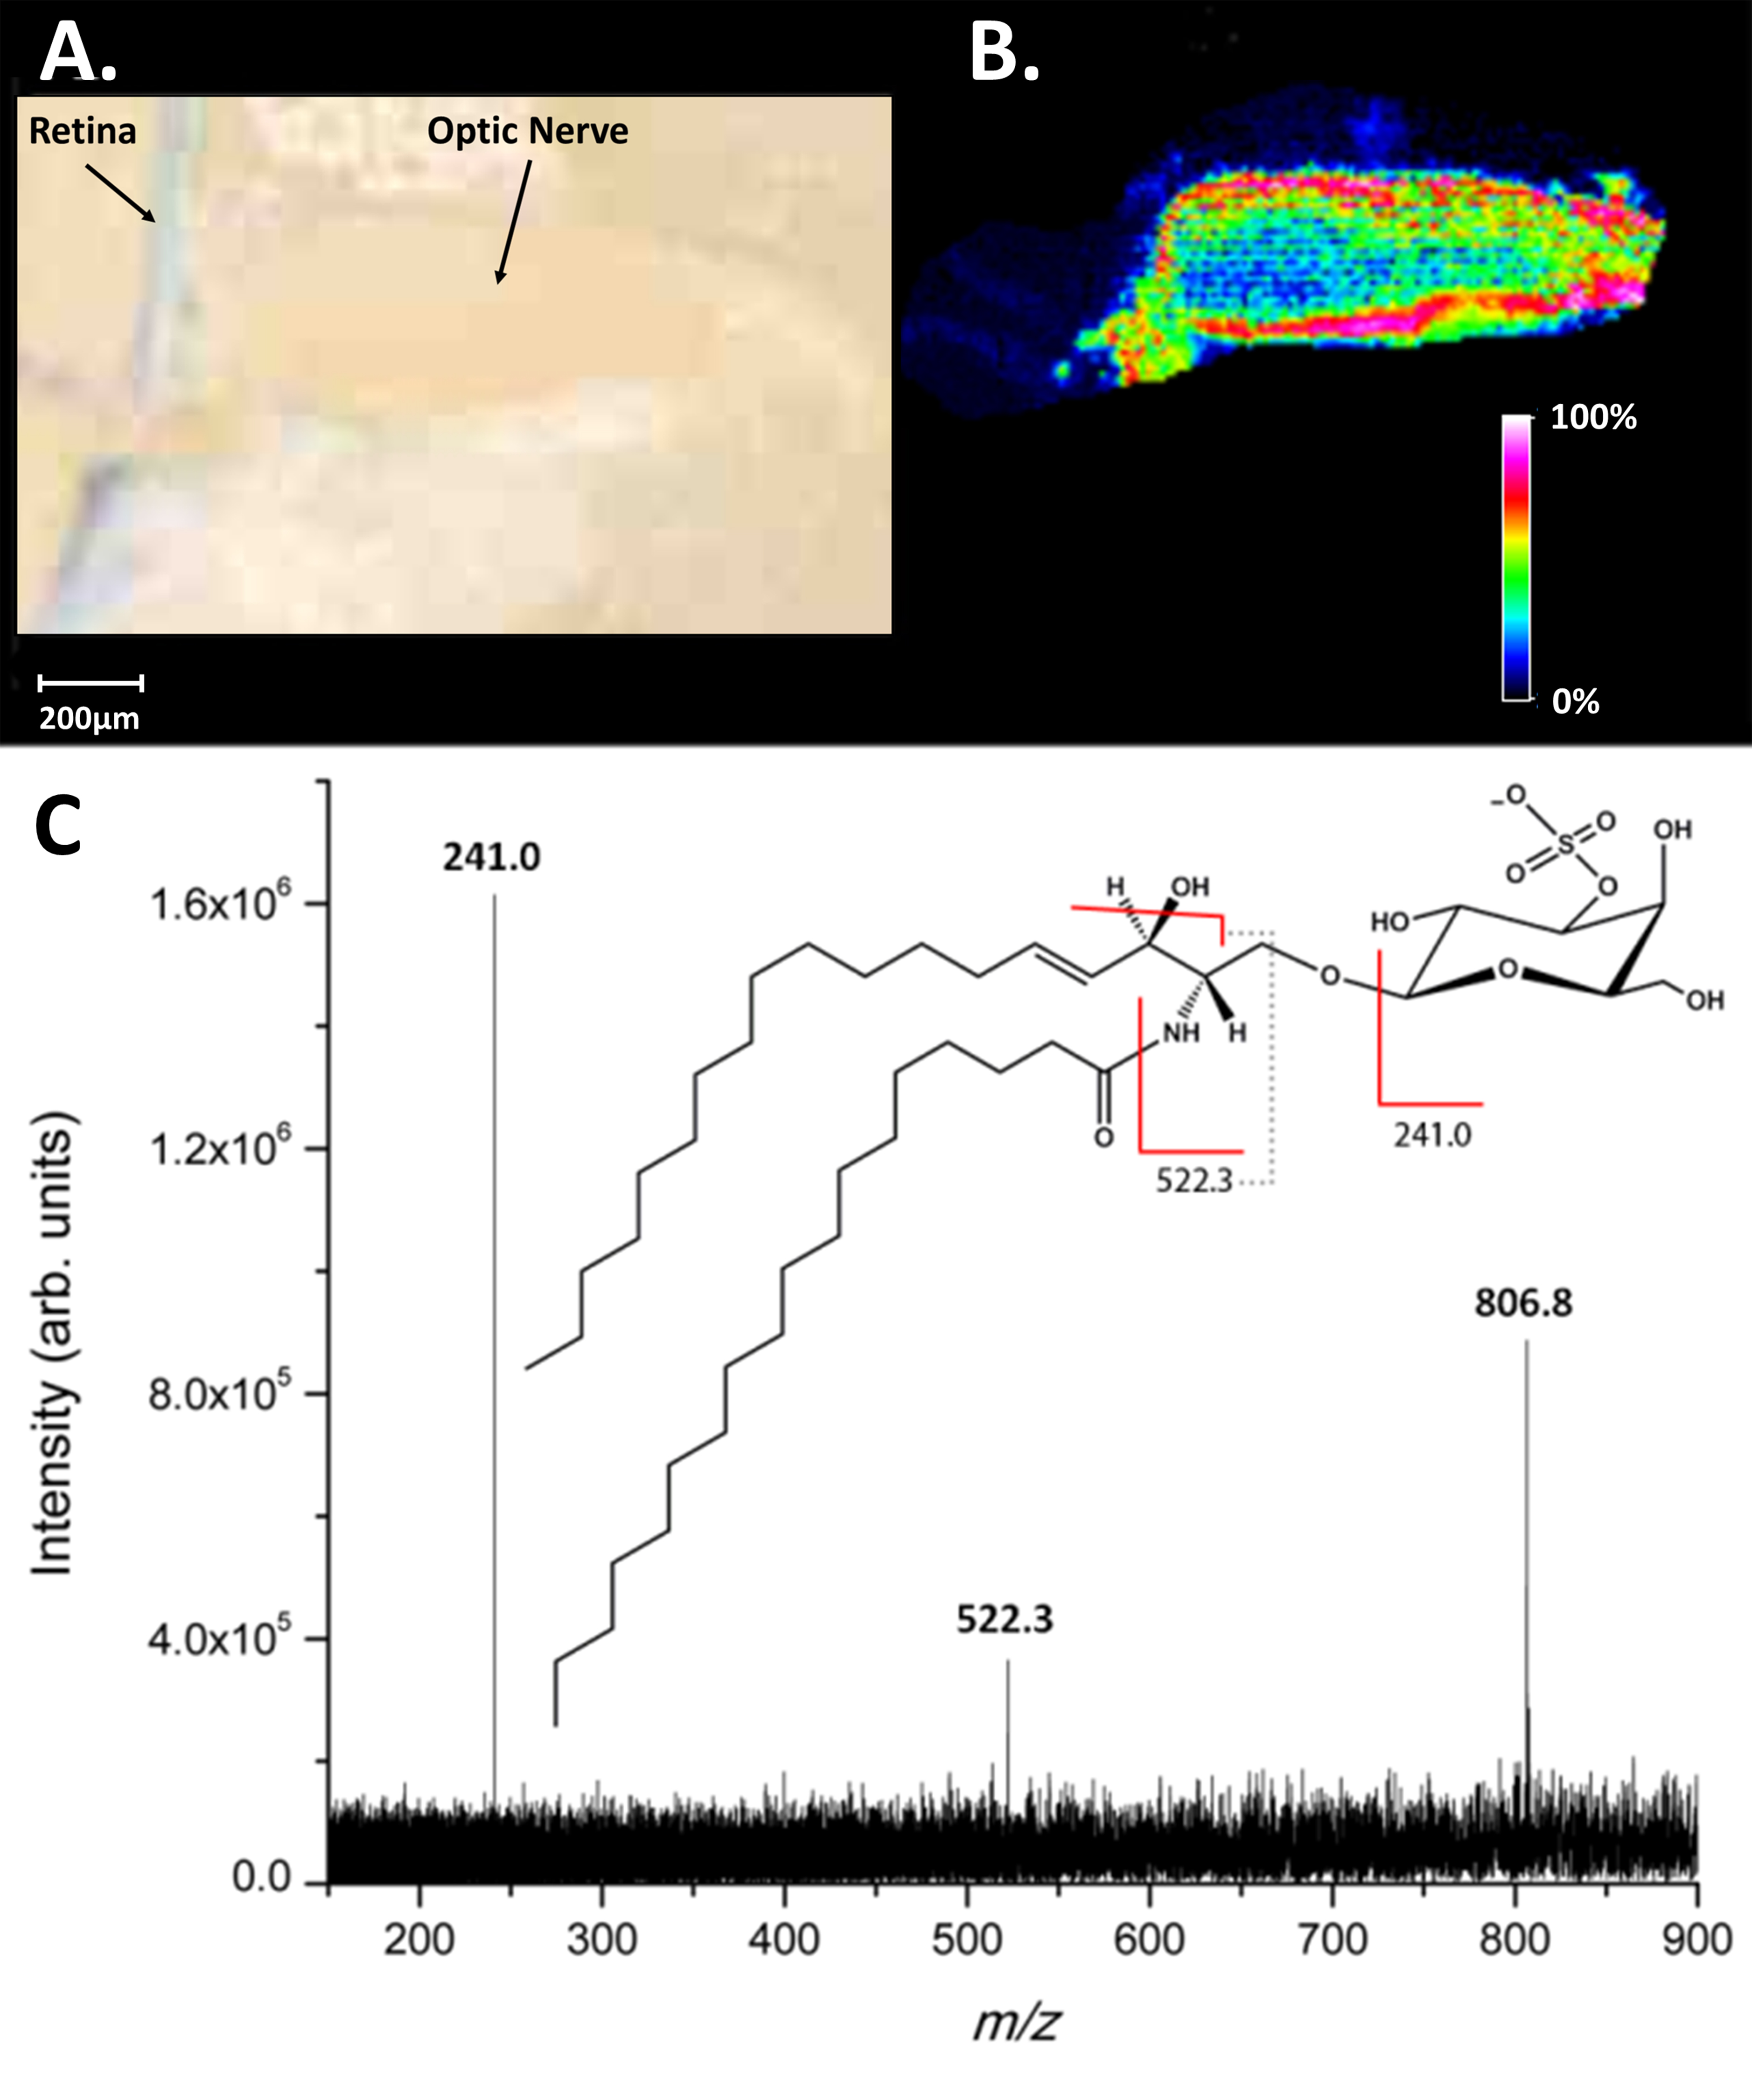
 Figure 3 of
Anderson, Mol Vis 2013; 19:581-592.
Figure 3 of
Anderson, Mol Vis 2013; 19:581-592.