Figure 3. Volcano plot of significance against the relative expression differences between the control and treated groups (A–C). Each dot represents one of the 81 microRNAs (miRNAs) that was filtered and had detectable expression in either treatment.
The X-axis displays log2-transformed signal intensity differences between the control group and the experimental group; the Y axis
is the log-odds calculated according to the moderated Student t statistic test for differential expression between the control
group and the treated group. The horizontal dashed line and the vertical lines represent significance threshold log-odds=2
and twofold expression differences, respectively. All spots above the horizontal dashed line are miRNAs that were identified
as showing significant differential expression between the two treatments. MiRNAs positioned in the left and right upper-lateral
quadrants represent downregulation and upregulation, respectively.
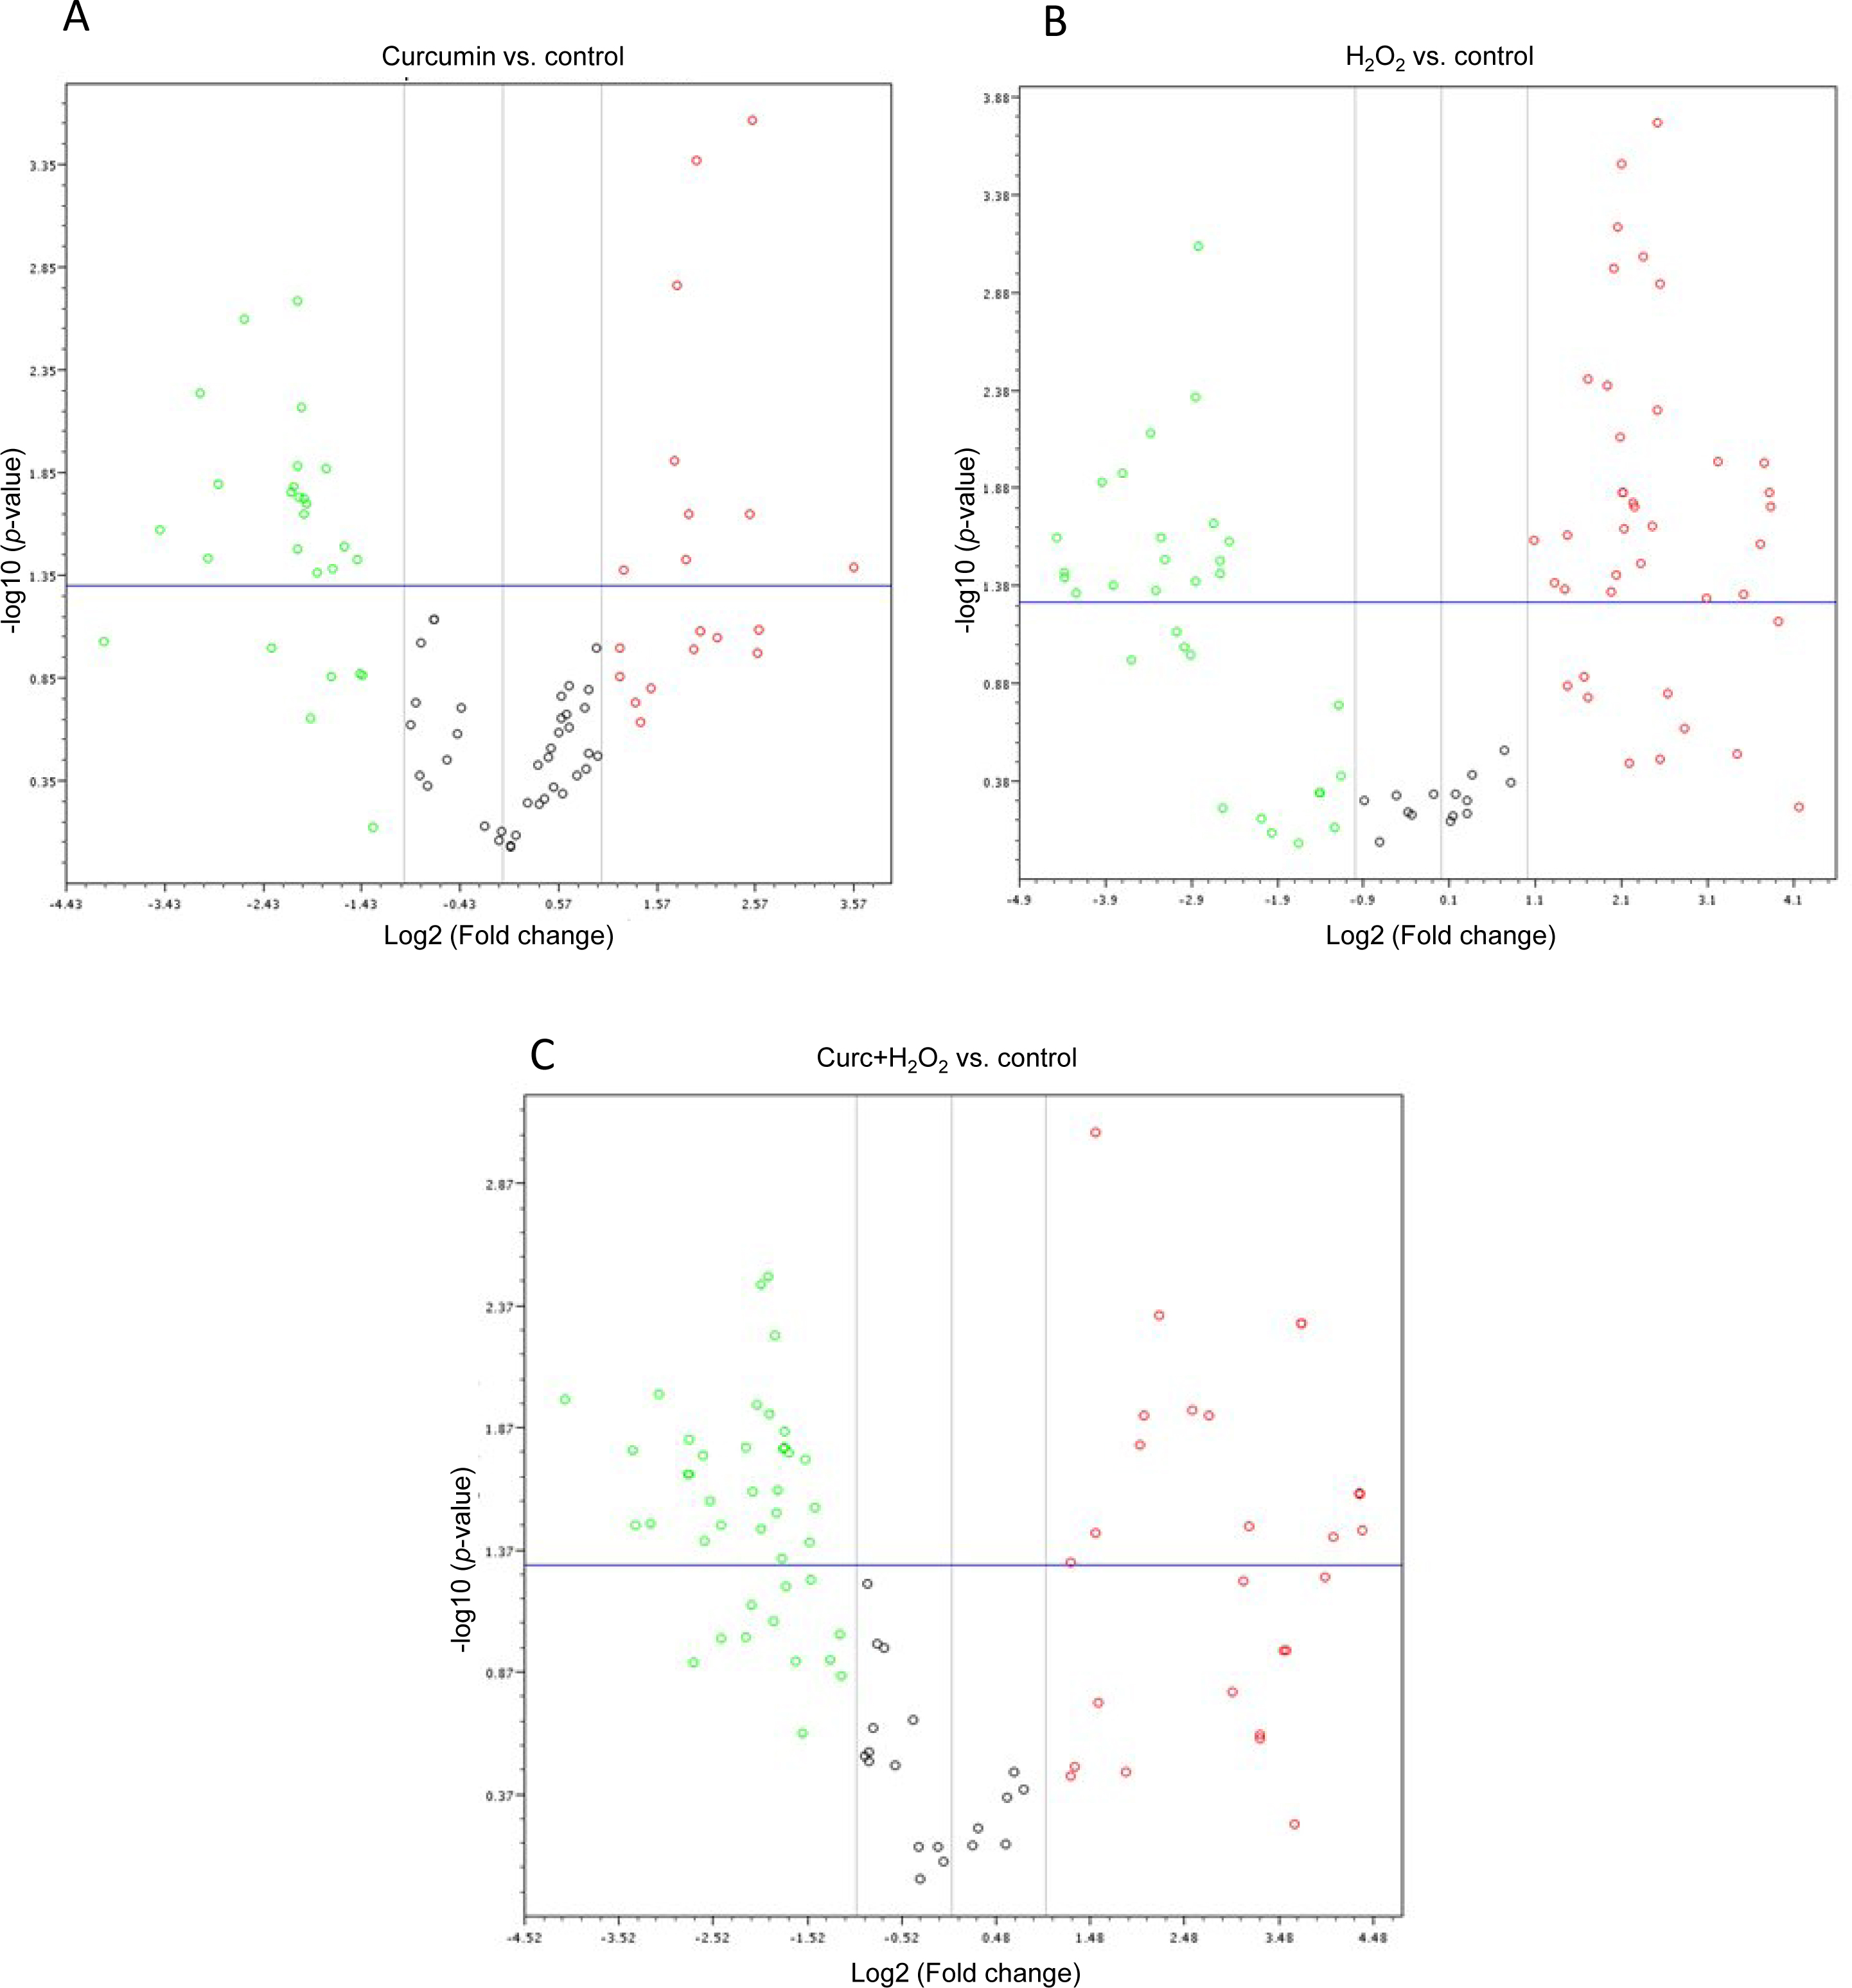
 Figure 3 of
Howell, Mol Vis 2013; 19:544-560.
Figure 3 of
Howell, Mol Vis 2013; 19:544-560.