Figure 2. Clustergram or heatmap analysis: Curcumin alters microRNAs (miRNAs) expression profiling in ARPE-19 cells. This clustergram
or heatmap represents the expression levels of 81 microRNAs (miRNAs) in four conditions (control, curcumin, hydrogen peroxide
[H2O2], and curc+H2O2) relative to an average of four housekeeping genes. ARPE-19 cells were treated with 20 μM curcumin and 200 μM H2O2 for 6 and 18 h, respectively. In the curc+H2O2 group, the cells were treated with curcumin for 6 h before H2O2 insult for 18 h. Cells with vehicle DMSO were used as control. Each vertical line in the heatmap represents a single miRNA,
and the rows represent groups. Samples clustered according to the condition. Red represents high expression, while green represents
low expression. The average Ct values for miRNAs with minimum (Min) and Maximum (Max) expression are given in parentheses. Based on clustering, curcumin
and H2O2 alone changed the expression of several miRNAs compared with the control. In addition, curcumin pretreatment altered H2O2-induced miRNA expression. There were three samples (n=3) in each condition.
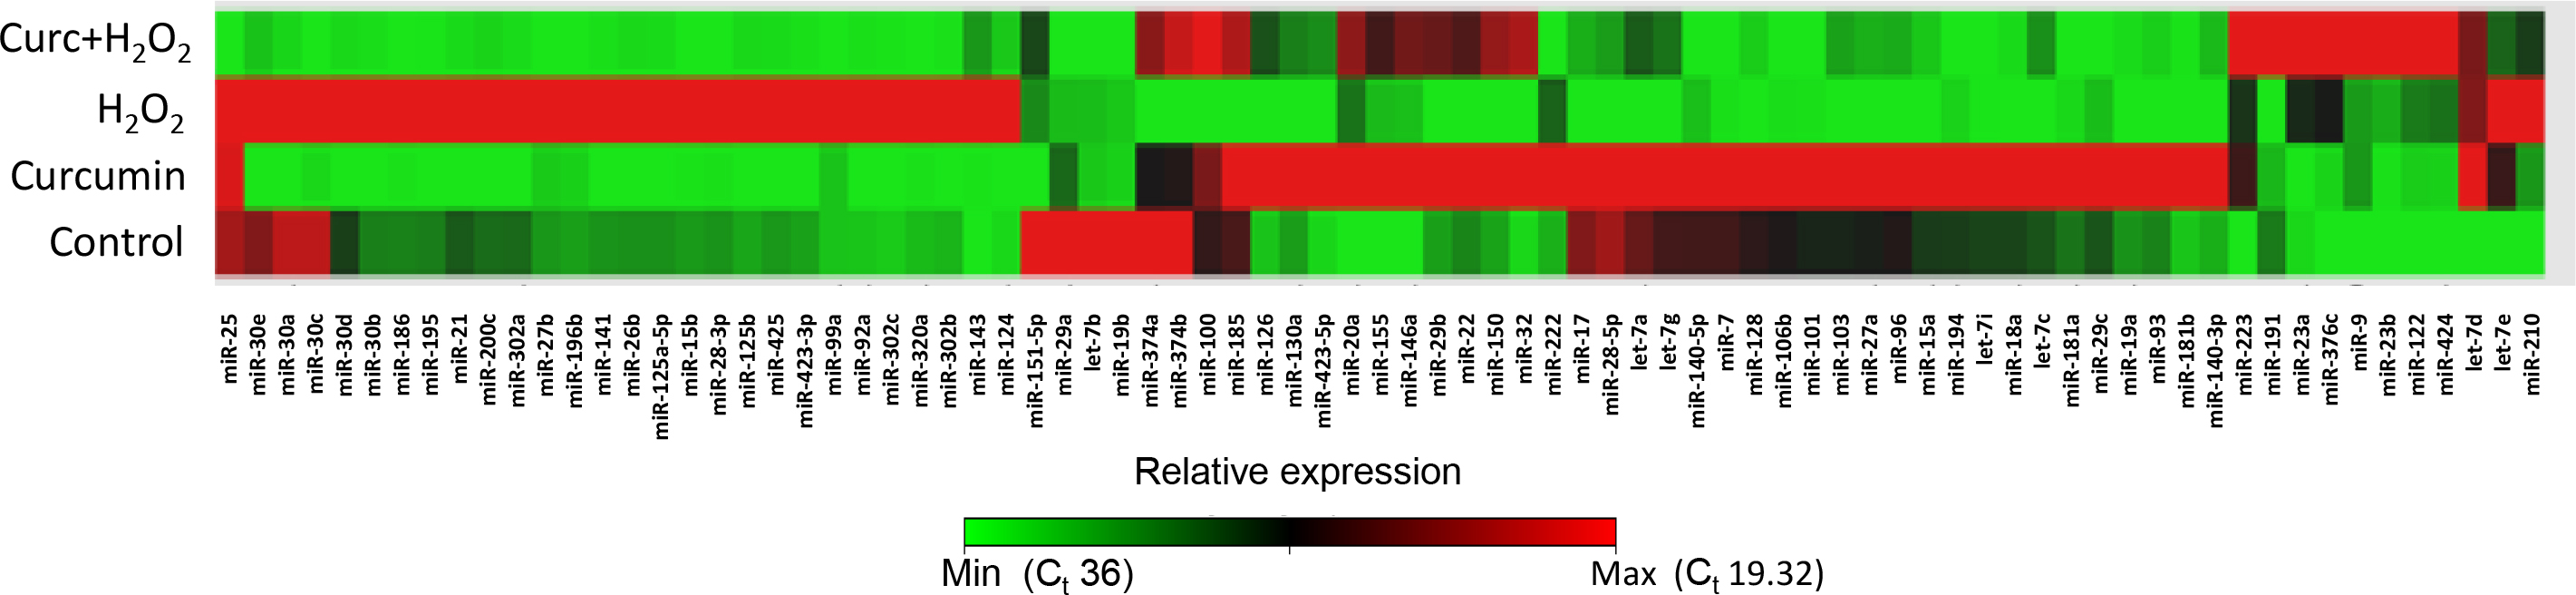
 Figure 2 of
Howell, Mol Vis 2013; 19:544-560.
Figure 2 of
Howell, Mol Vis 2013; 19:544-560.