Figure 4. Quantification of photodynamic therapy (PDT) results. Choroidal neovascularization (CNV) was induced at d0 and PDT was performed
at d10. The CNV area was measured after perfusion with FITC-dextran. No effects were observed when PDT was omitted (dotted
lines). The values for Visudyne or cationic liposomes (CL)-VTP were significantly smaller than those for the controls without
drug treatment (solid lines). Repeated PDT even increased the effect (dashed lines). Six to eight mice were used per treatment
and time point. Error bars indicate standard errors of the means. Asterisks indicate significant differences compared to the
corresponding values without drug treatment as determined with ANOVA. P values calculated by ANOVA and Tukey correction: d12:
CL-VTP, with PDT/no drug, with PDT: 0.0159, Visudyne, with PDT/no drug, with PDT: 0.0353, d14: CL-VTP, with PDT/no drug, with
PDT: 0.0036, Visudyne, with PDT/no drug, with PDT: 0.0319, d17: CL-VTP, with PDT/no drug, with PDT: 0.0157, Visudyne, with
PDT/no drug, with PDT: 0.0173, CL-VTP, 3x PDT/no drug, with PDT: 0.0267, Visudyne, 3x PDT/no drug, with PDT: 0.0447.
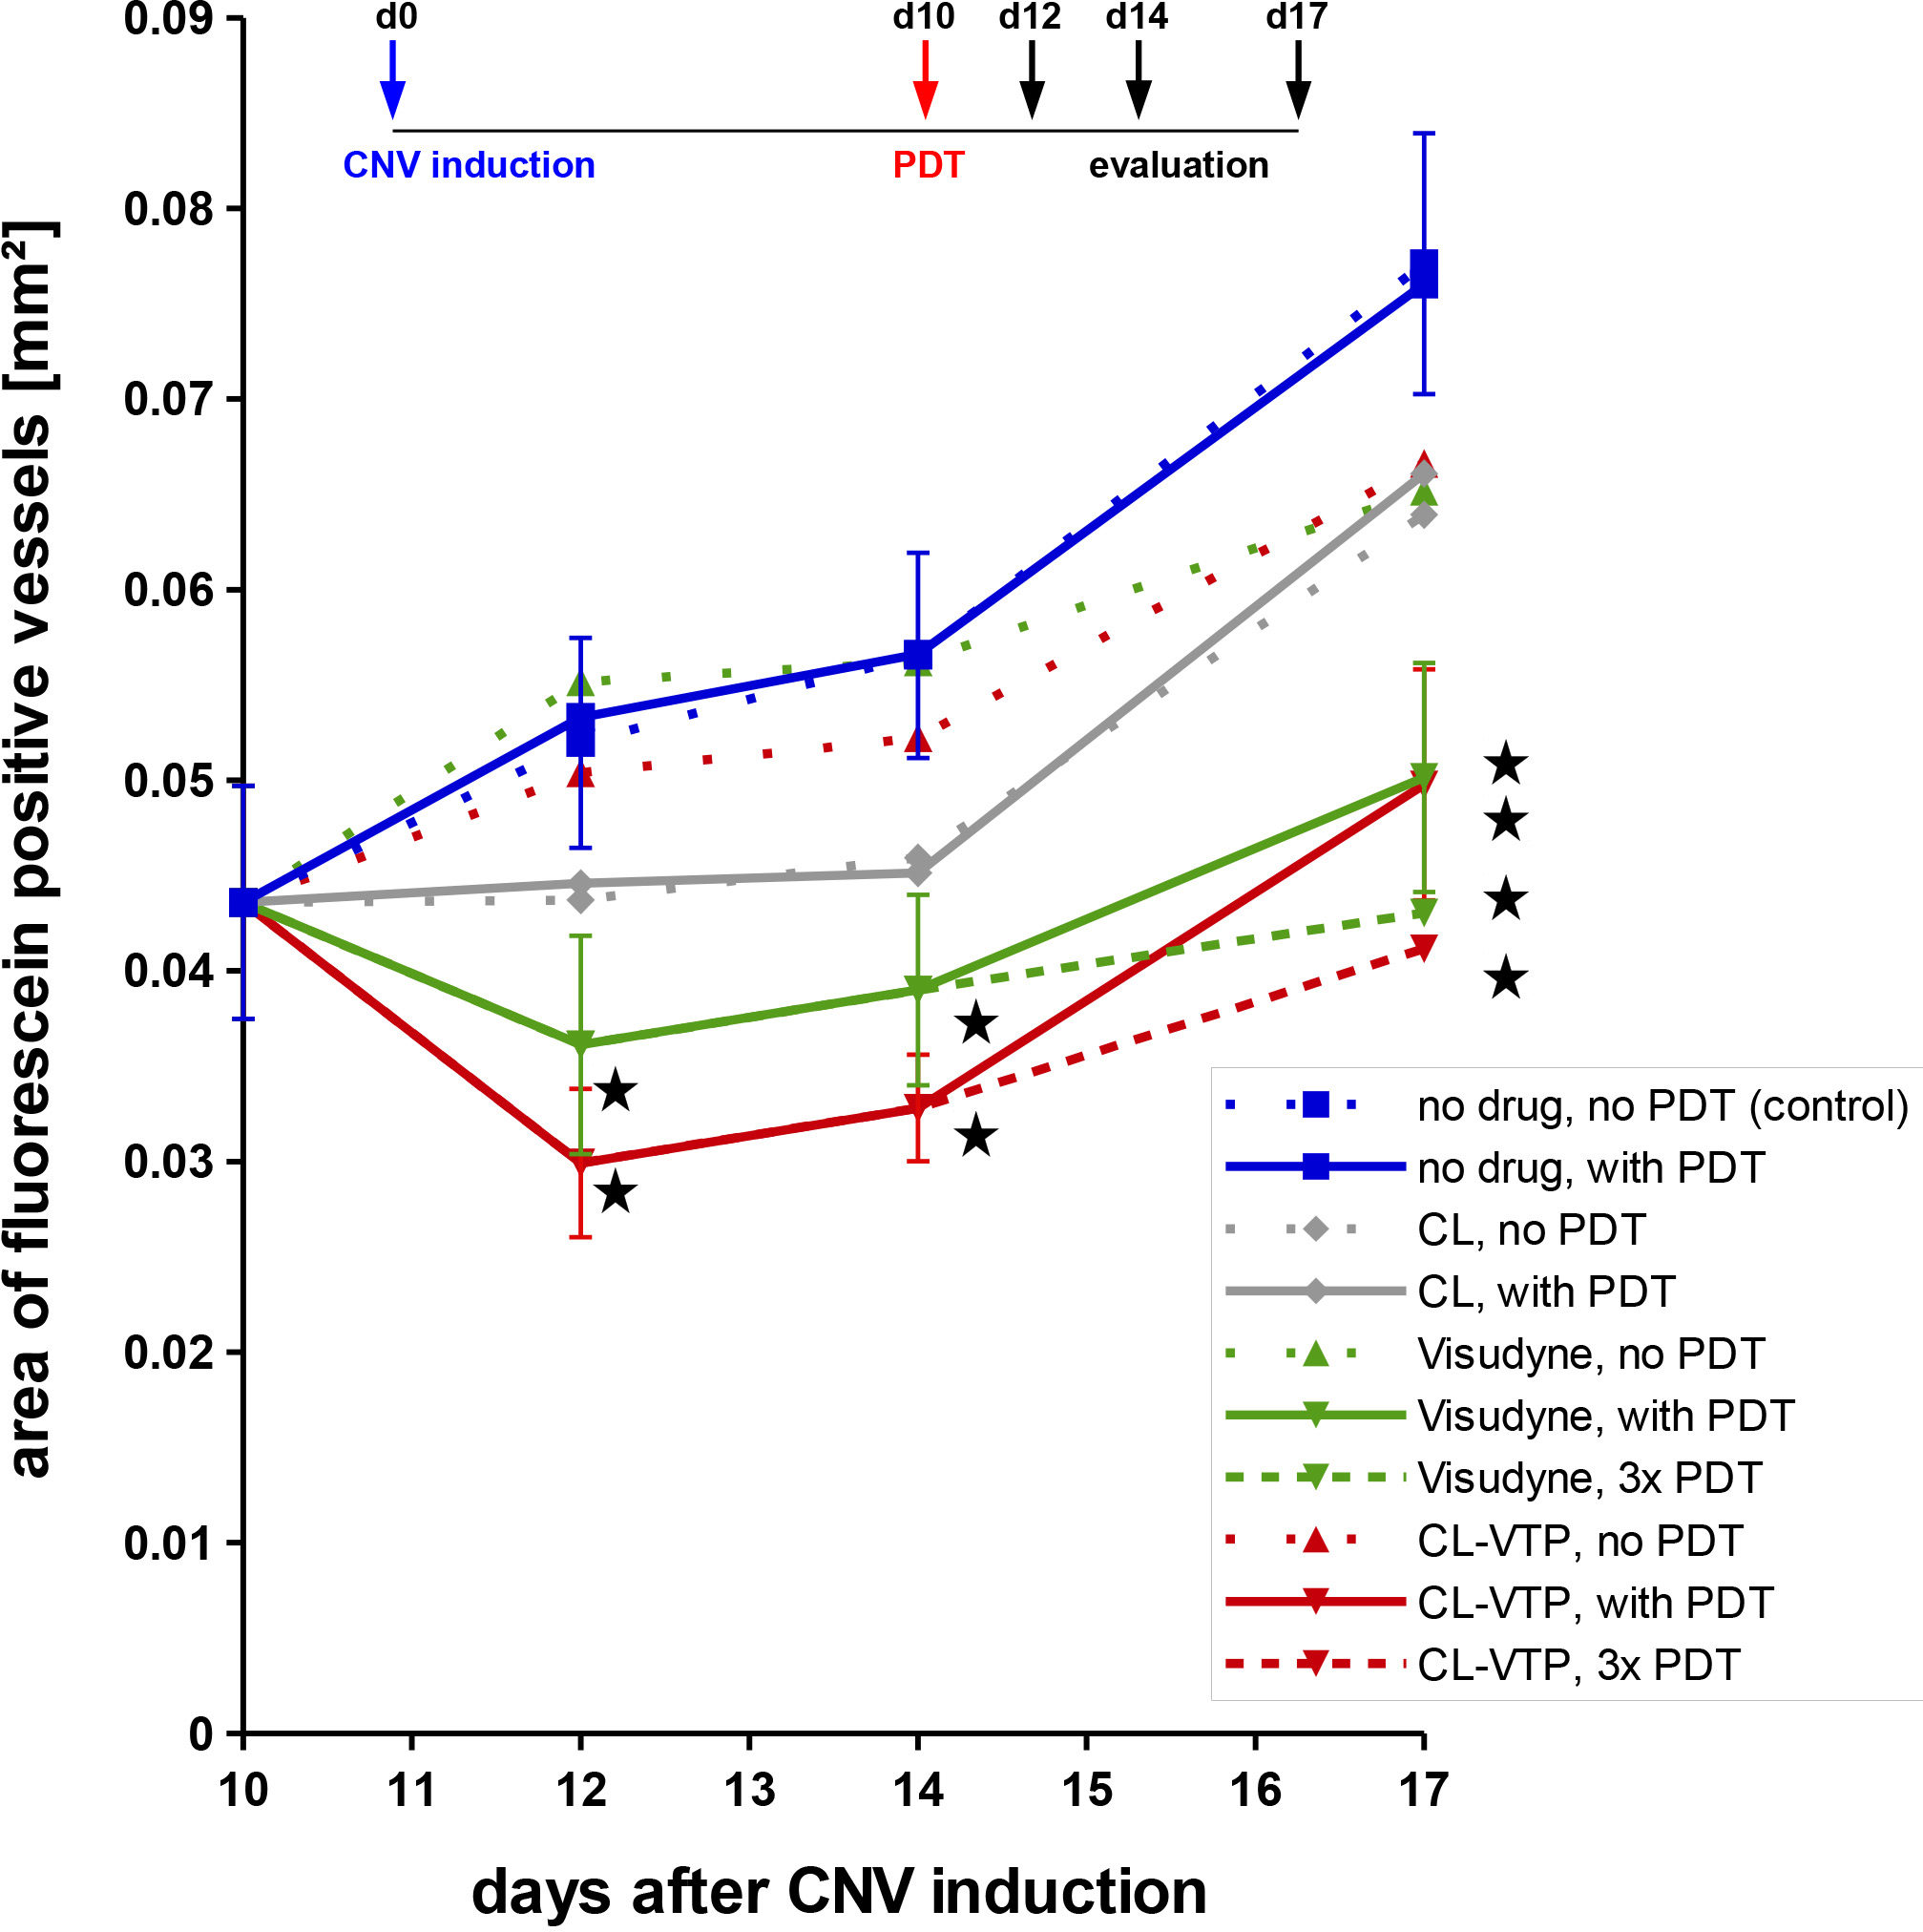
 Figure 4 of
Gross, Mol Vis 2013; 19:54-61.
Figure 4 of
Gross, Mol Vis 2013; 19:54-61.