Figure 5. Inhibition of macrophage infiltration by SRPIN340. A: Bars represent real-time polymerase chain reaction (PCR) analysis of the relative change in F4/80 expression in the RPE-choroid complex obtained from CNV mice 3 days after laser photocoagulation combined with intravitreal
injection of 0.1% DMSO or 20 pmol SRPIN340. Values are mean±SEM (n=6 to 8; n represents the number of eyes). B: Micrographs depict representative F4/80 immunostaining in CNV lesions 3 days after laser photocoagulation combined with intravitreal injection of 0.1% DMSO or 20
pmol SRPIN340. (left). CNV lesions stained for CD31 (middle). Immunofluorescence staining for F4/80 (right). Merged image.
Bar, 100 μm. C: Quantitative analysis of F4/80-positive cells. Bars represent the average number of infiltrated macrophages in each CNV
lesion. Values are mean±SEM (n=13 to 15); n represents the number of CNV lesions. *, p<0.05.
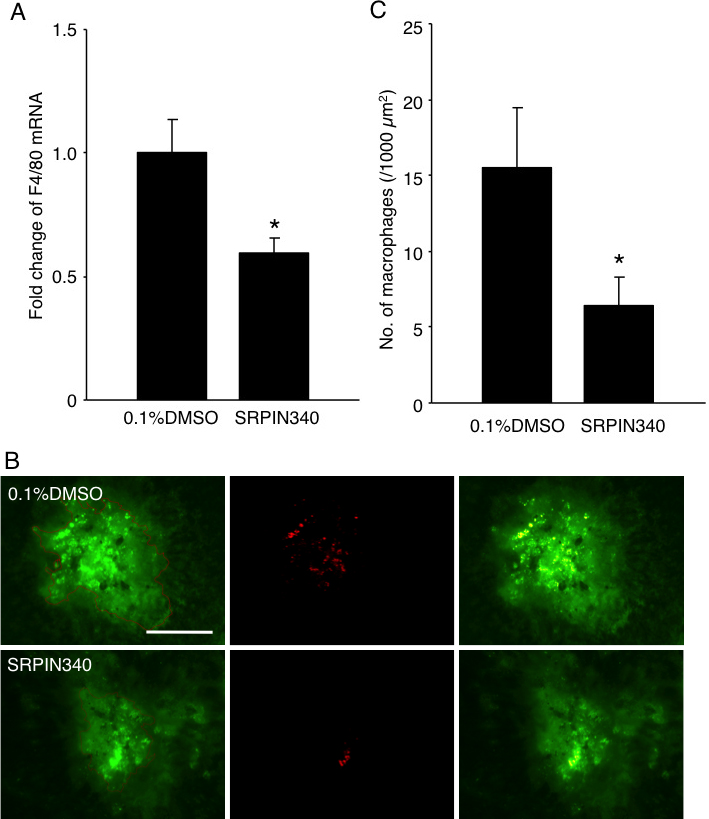
 Figure 5 of
Dong, Mol Vis 2013; 19:536-543.
Figure 5 of
Dong, Mol Vis 2013; 19:536-543.