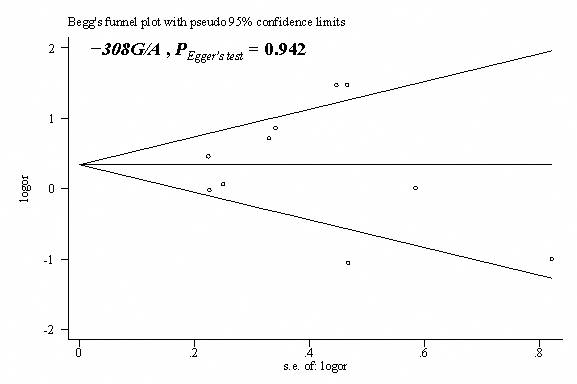
Figure 2. Begg’s funnel plot with the Egger’s test for publication bias between
TNF-α −308G/A (
rs1800629) polymorphisms and risks of open angle glaucoma. The horizontal line in the funnel plot indicates the fixed-effects summary
estimate, whereas the diagonal lines pseudo-95% CI limits about the effect estimate. In the absence of publication bias, studies
are distributed symmetrically above and below the horizontal line.
 Figure 2 of
Xin, Mol Vis 2013; 19:526-535.
Figure 2 of
Xin, Mol Vis 2013; 19:526-535.