Figure 2. Integrin β1 correlates with p63 positivity. All images are oriented with the epithelial side up and the stromal side down.
A-D: Double immunohistochemistry staining for integrin β1 (blue) and p63 (brown) showed the decreased expression of integrin
β1 and p63 (arrow) in the Low (D) as compared to the High group (A). The difference in integrin β1 expression was significant (p=0.0081; Student t test; High group n=43 versus Low group n=14). The image was magnified 200 times. B-C-E-F: p63 correlates with integrin β1 but not with integrin β4 and integrin α6. No statistical difference was observed in the
distribution of the integrin β4 (blue) and p63 (brown) panels (B and E) and the integrin α6 (blue) and p63 (brown) panels (C and F) in the two groups. The image was magnified 400 times.
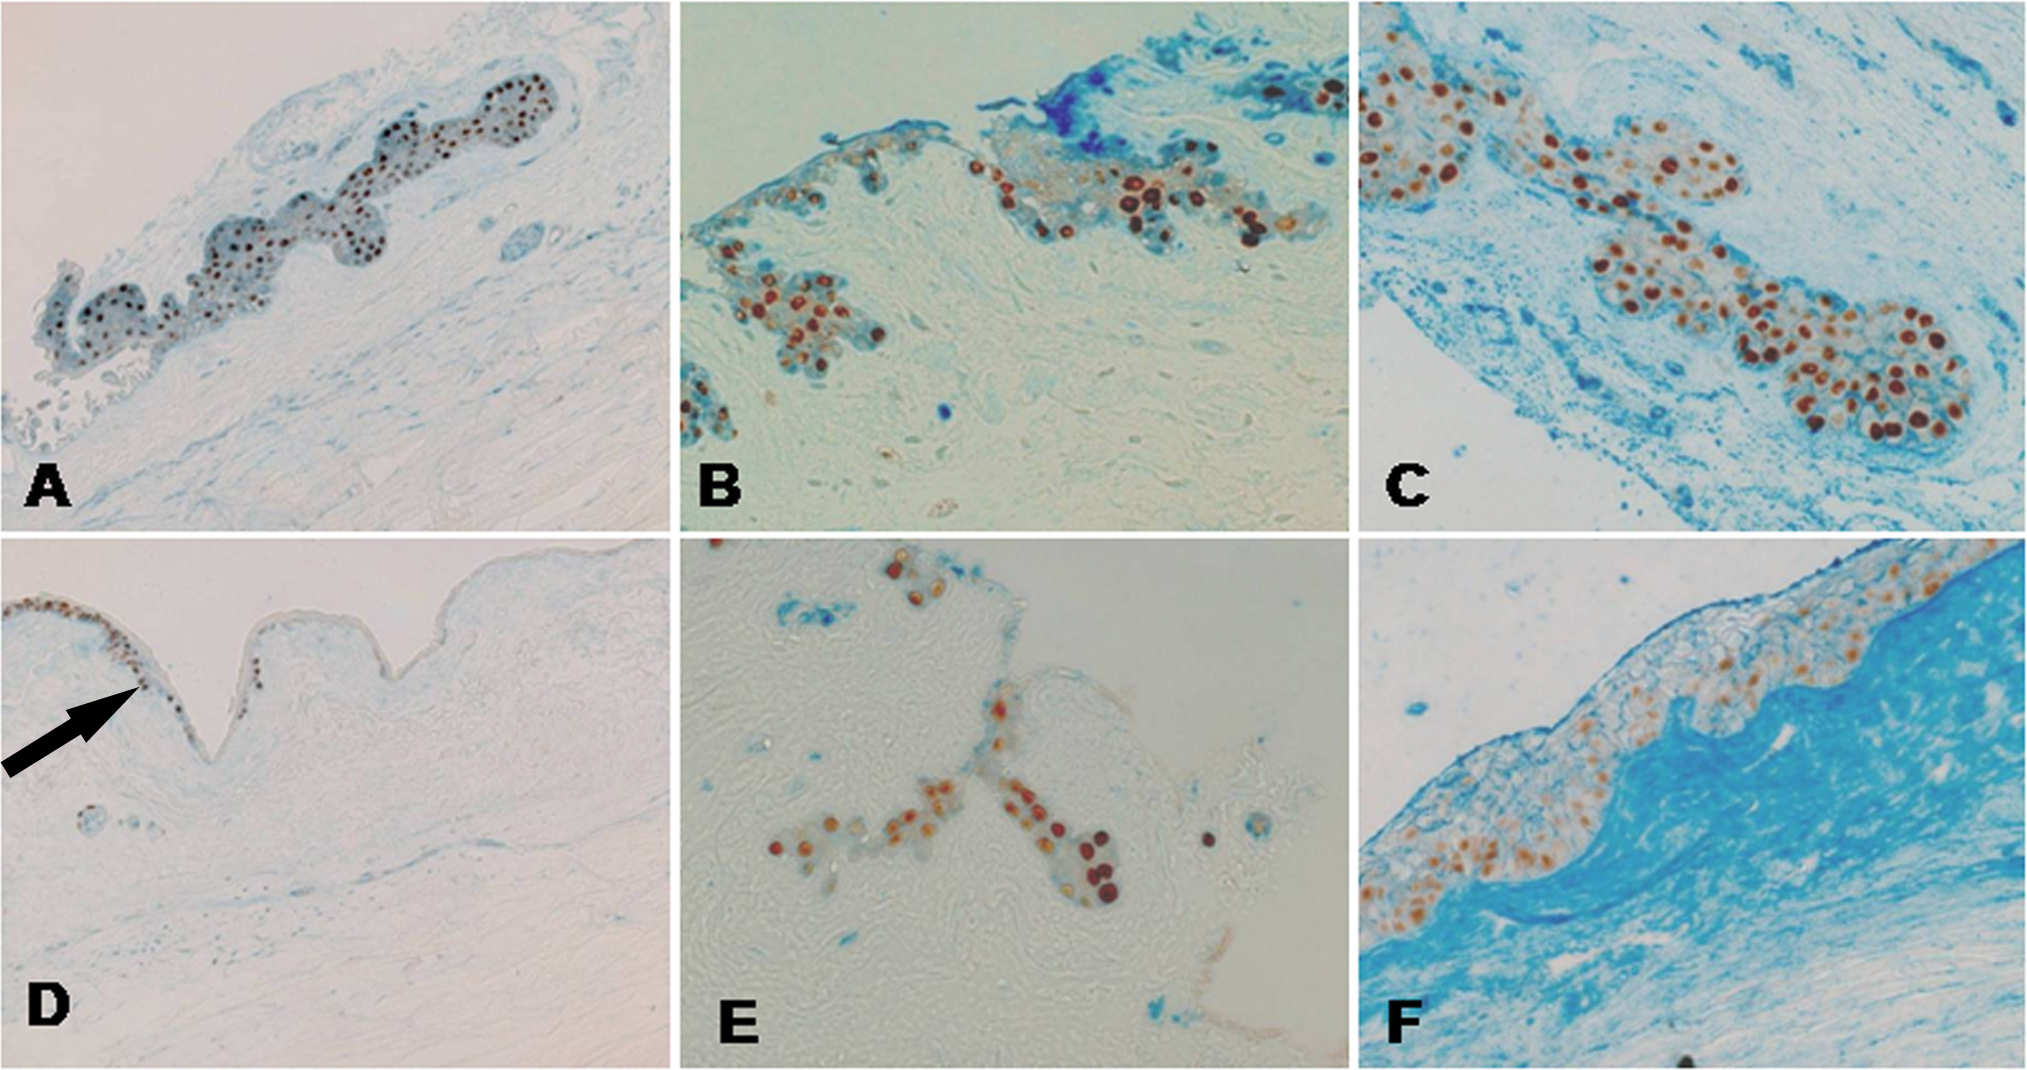
 Figure 2 of
Nubile, Mol Vis 2013; 19:516-525.
Figure 2 of
Nubile, Mol Vis 2013; 19:516-525.