Figure 1. Average expression of five small ncRNAs and miRNAs compared at P5, P6, P9, and P14. Mean expression relative to the standard
pool for each developmental stage. n=4 at each time point. Error bars represent ± standard deviation. Statistical analysis
was performed using one-way ANOVA, with the significance level (alpha) adjusted for multiple comparisons (Tukey’s HSD test)
at p<0.0125. For 5S rRNA, a Kruskal–Wallis test was used and the significance (alpha) level set at 0.05. * p<0.0125.
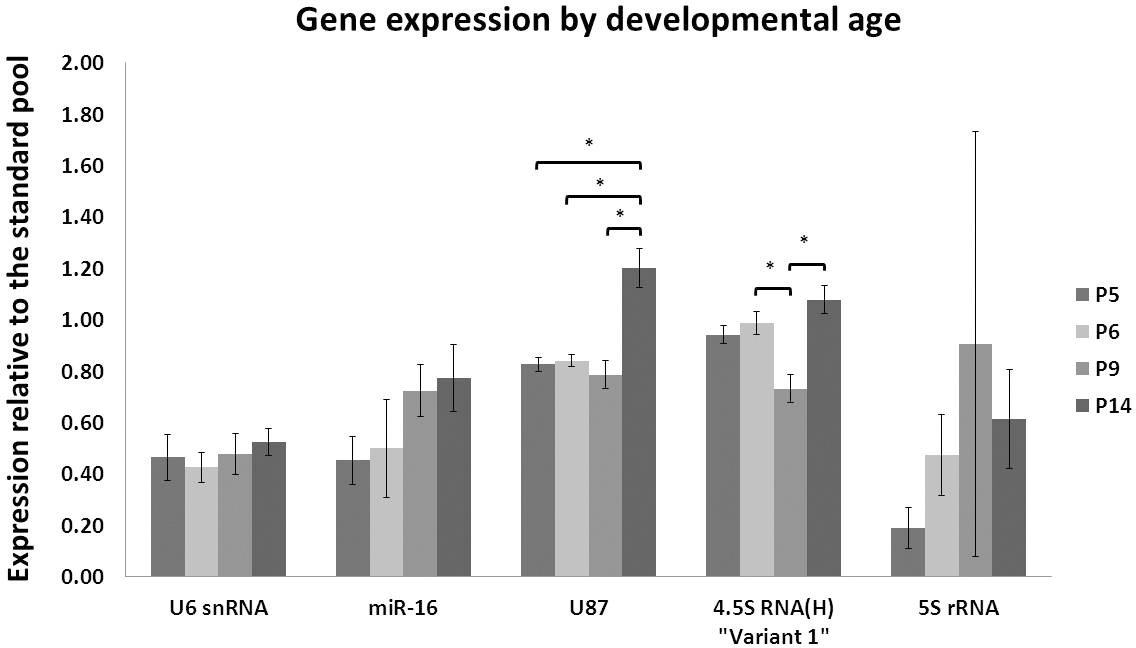
 Figure 1 of
Tea, Mol Vis 2013; 19:501-508.
Figure 1 of
Tea, Mol Vis 2013; 19:501-508.