Figure 1. Glial activation in neuroretina from diabetic patients. Comparison of glial fibrilllar acidic protein (GFAP) immunofluorescence
(red) in the human retina between representative samples from a nondiabetic (A) and diabetic (B) donor. In the diabetic retina, the Müller cells show abundant GFAP immunofluorescence and the radial processes stain intensely
throughout the inner and outer retina. ONL, outer nuclear layer; INL, inner nuclear layer; GCL, ganglion cell layer. The bar
represents 20 μm. C: Quantification of GFAP immunofluorescence in nondiabetic (n=5) and diabetic retinas (n=5). D: Western blot analysis of neuroretinas corresponding to three representative diabetic and nondiabetic retinas. E: Densitometric quantification showing higher GFAP in the retinas from five diabetic donors compared with the retinas from
five nondiabetic donors. Results are expressed as means±SD. *p<0.001. **p=0.04.
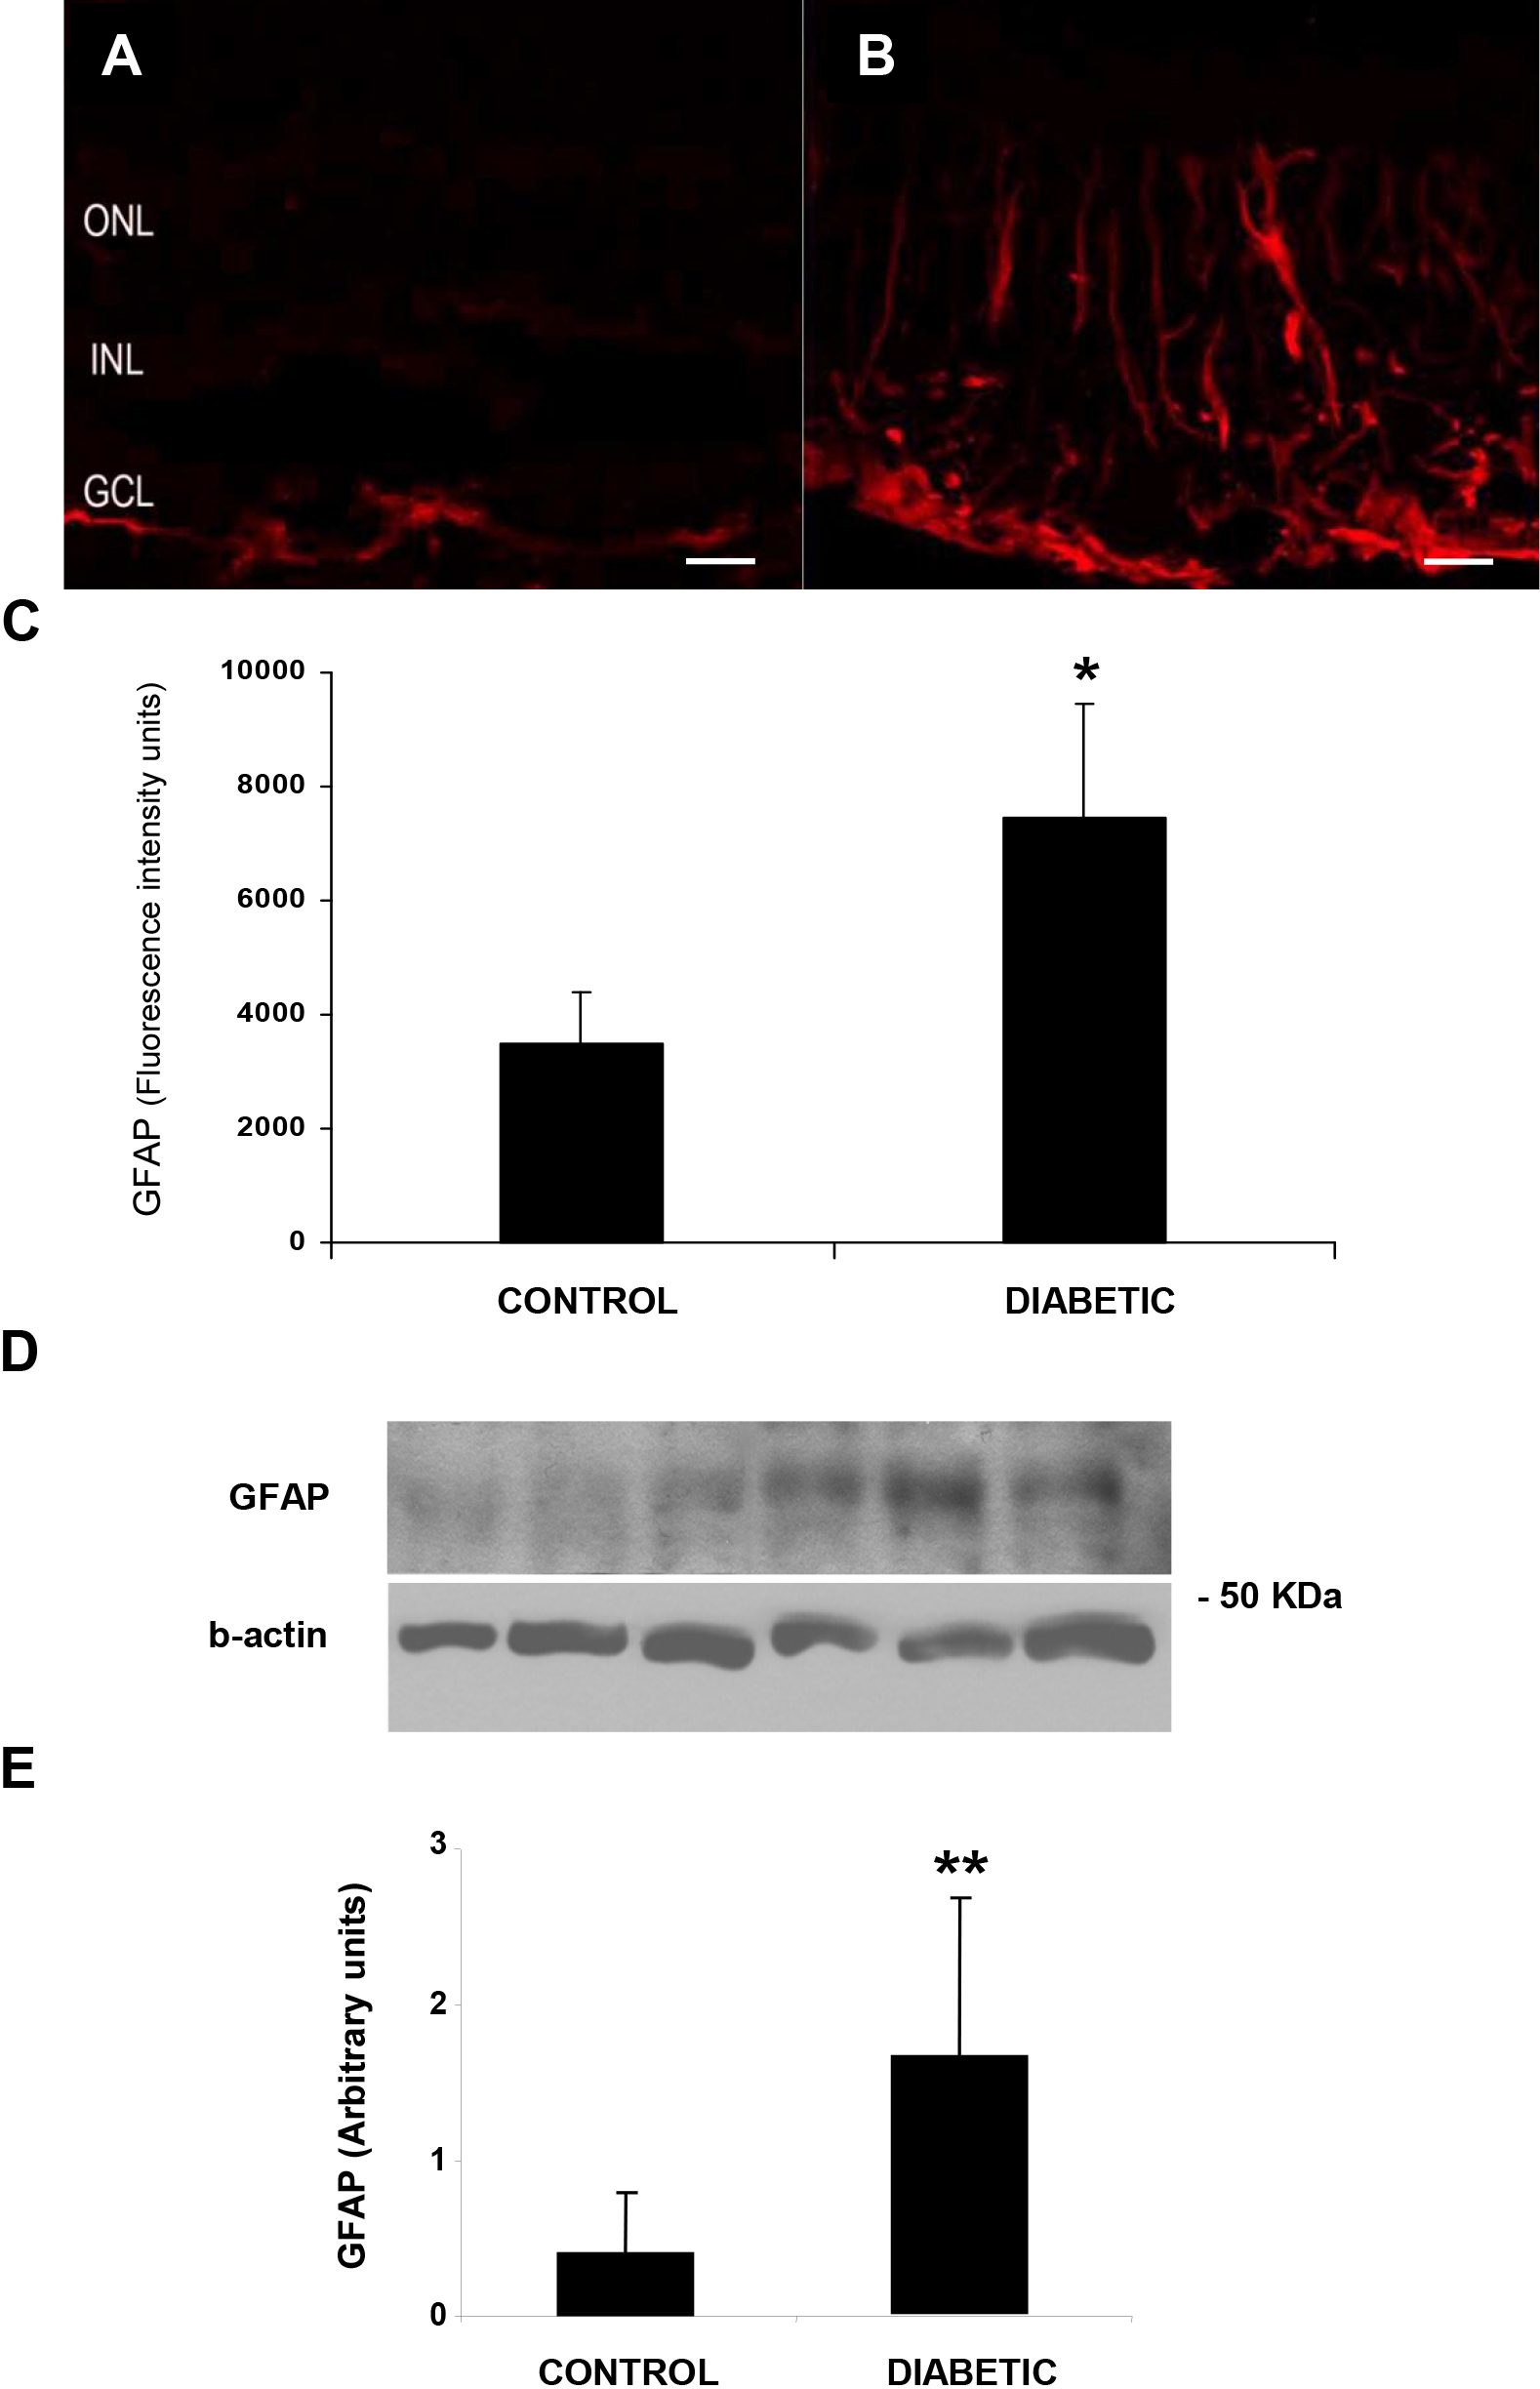
 Figure 1 of
Valverde, Mol Vis 2013; 19:47-53.
Figure 1 of
Valverde, Mol Vis 2013; 19:47-53.