Figure 1. The 14C bomb curve is recorded in biomolecules. Aboveground nuclear testing nearly doubled the level of radiocarbon (as 14CO2) in the atmosphere between 1955 and 1963. The atmospheric 14C levels depicted by the dark blue trace are growing season averages for the northern hemisphere expressed in F14C units (fraction modern with δ13C fractionation correction). These 14C levels are recorded in annual plant growth and human diets. Human tissue incorporates the contemporary 14C signature of individuals’ food at the time of synthesis. Years later, specific biomolecules can be isolated and measured
for 14C content to establish carbon turnover or lack thereof, as in the cellulose of tree rings.
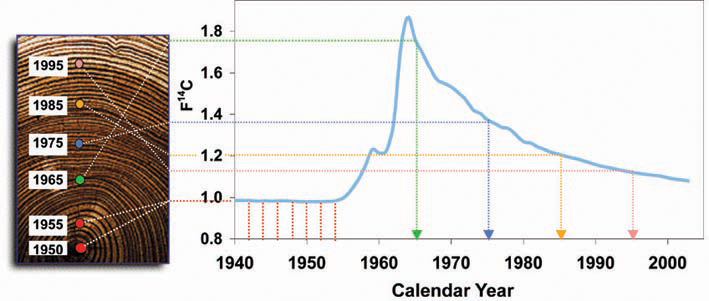
 Figure 1 of
Stewart, Mol Vis 2013; 19:463-475.
Figure 1 of
Stewart, Mol Vis 2013; 19:463-475.