Figure 1. Schematic representation of the deletions and duplications found in this study. Arabic numbers in the parentheses show the
occurrence times for each rearrangement. The white bars represent duplications, and the black ones indicate deletions. The
gray regions on the RB1 gene show the pocket domains.
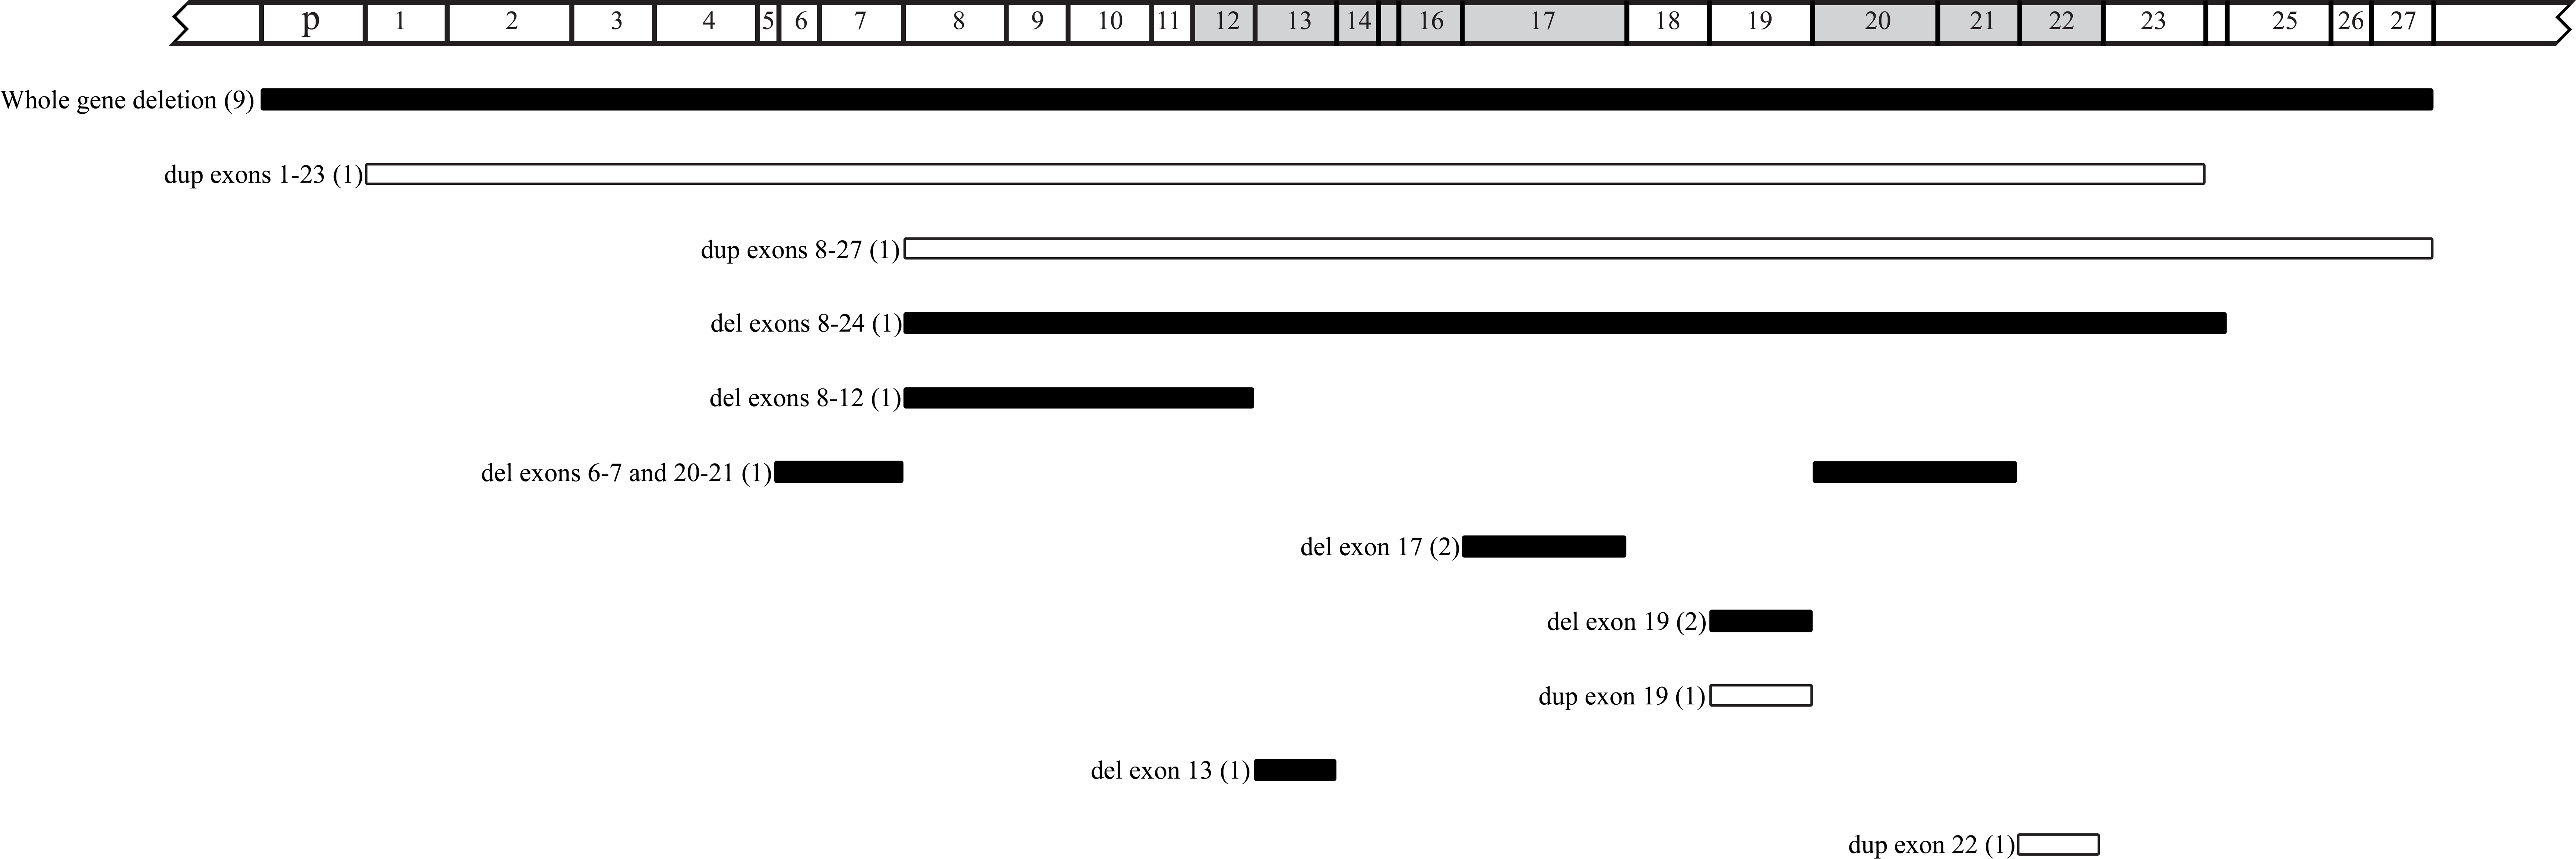
 Figure 1 of
Ahani, Mol Vis 2013; 19:454-462.
Figure 1 of
Ahani, Mol Vis 2013; 19:454-462.