Figure 3 of
Jiang, Mol Vis 2013; 19:418-423.
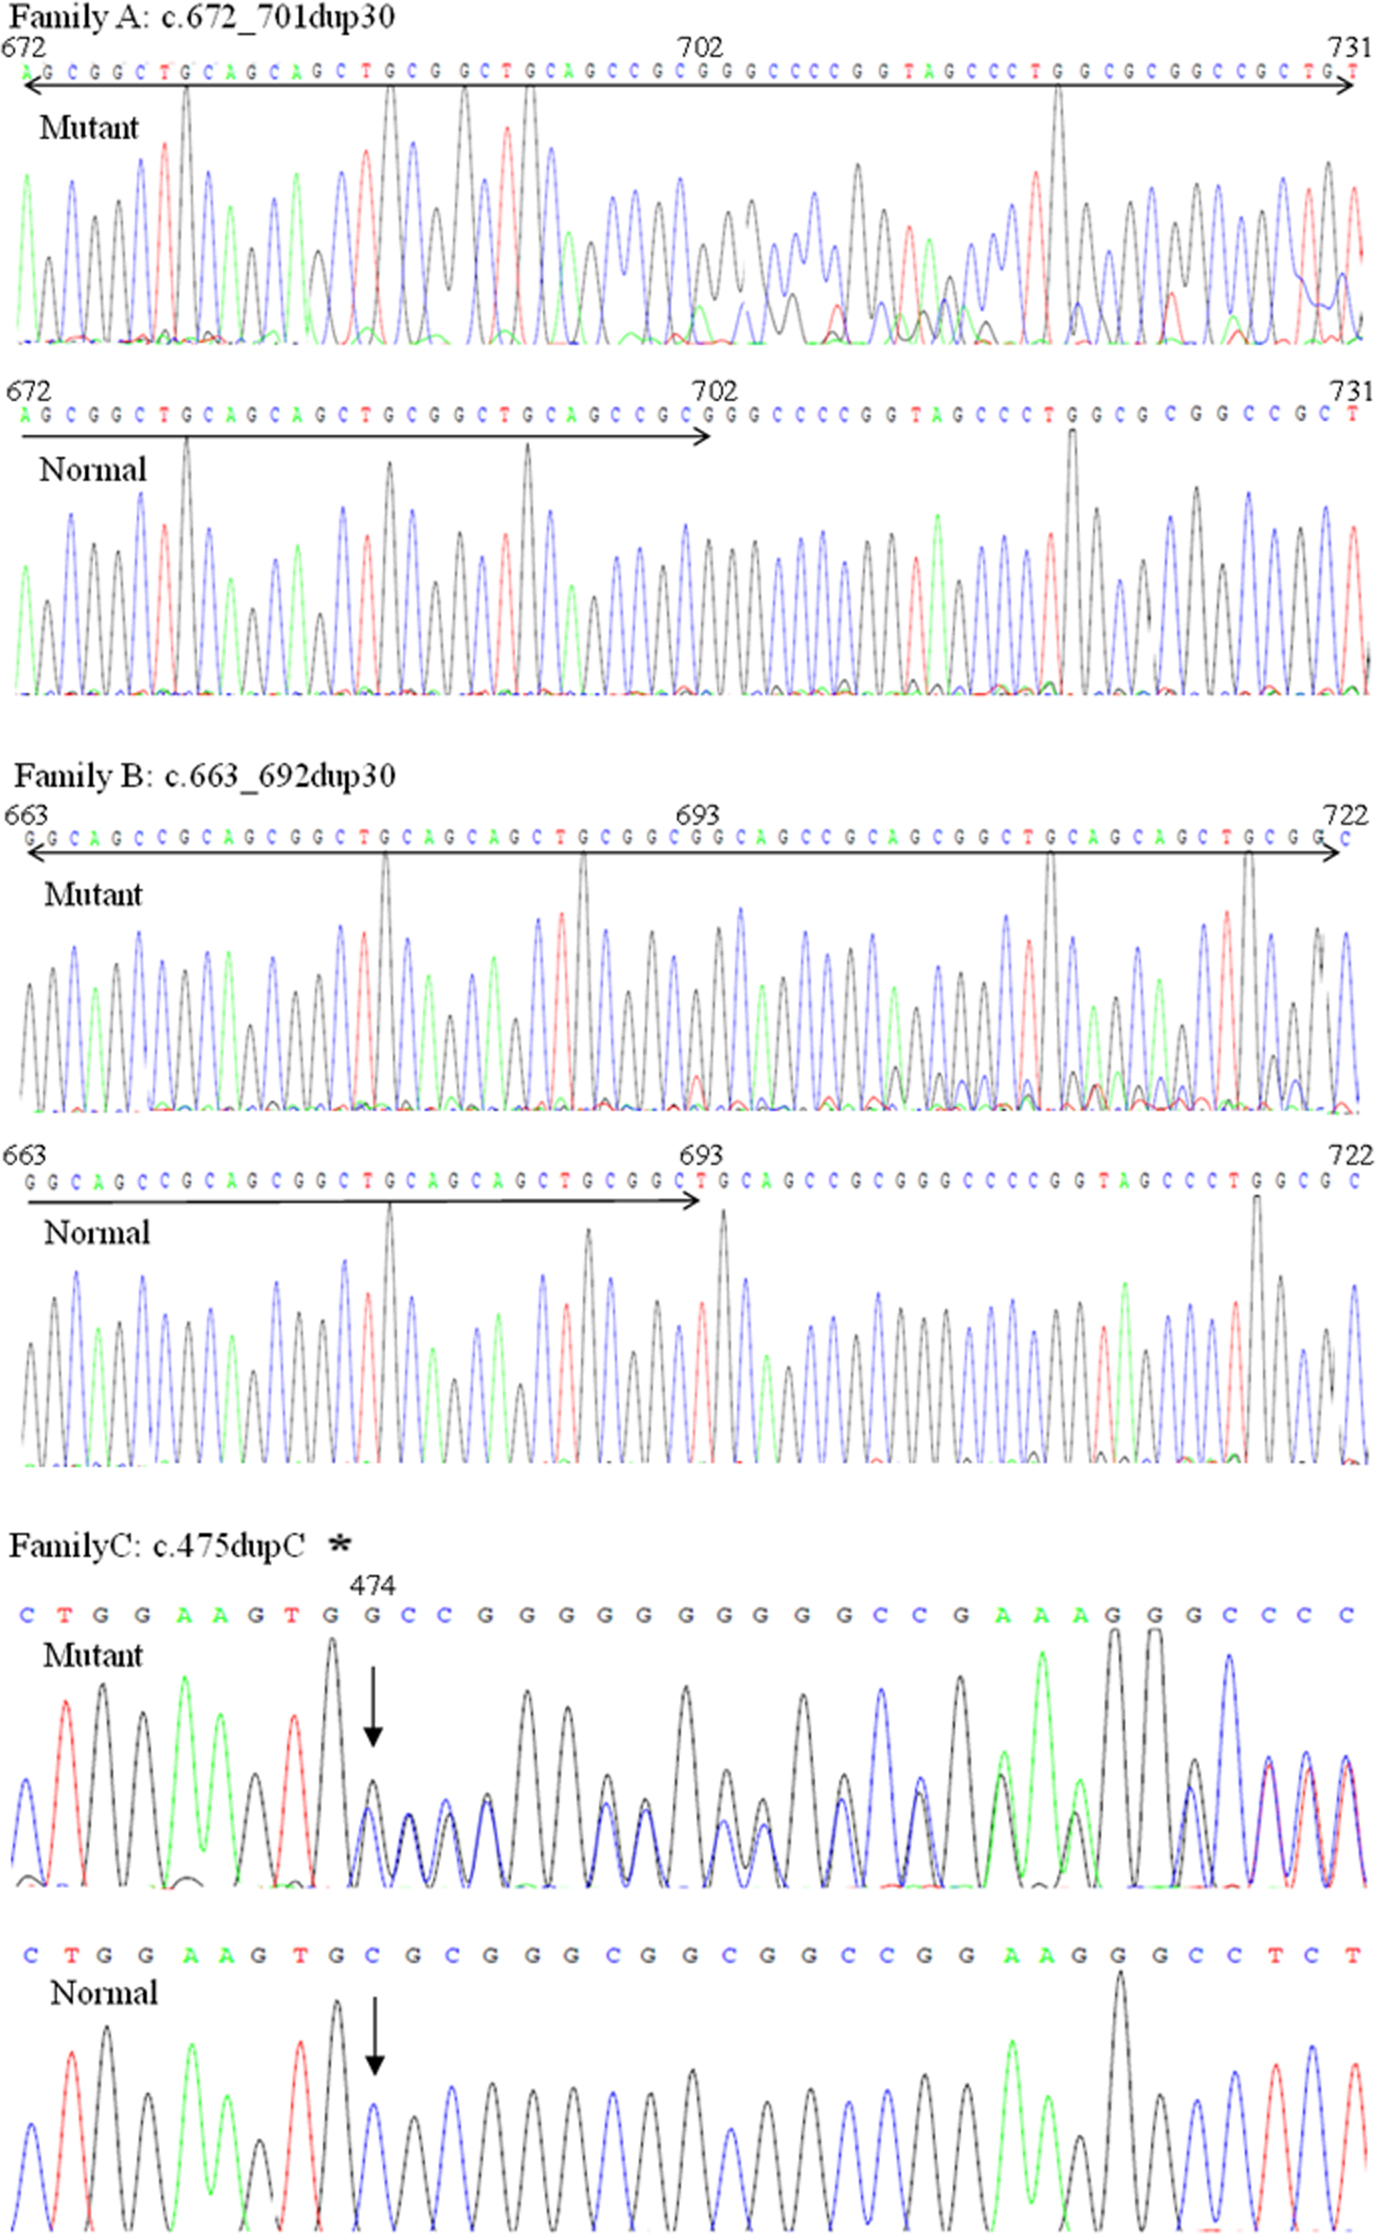
Figure 3.
Sequence chromatograms of the mutations. The mutant alleles identified in the present study were compared with the normal alleles. The asterisk shows the reverse DNA sequence chromatograms.
 Figure 3 of
Jiang, Mol Vis 2013; 19:418-423.
Figure 3 of
Jiang, Mol Vis 2013; 19:418-423.