Figure 5. Size exclusion chromatography of zebrafish soluble lens protein at three ages. Resulting chromatography peaks (A) were subsequently analyzed with one-dimensional gel electrophoresis and compared to purified bovine α-crystallin (B) to determine the purity of the zebrafish crystallins in peak 1. This peak contained a mixture of α- and β-crystallins in
all three ages examined, as determined by comparing the band sizes to typical ranges for each crystallin family (noted to
the right of the panel). The molecular sizes of the standards used are indicated.
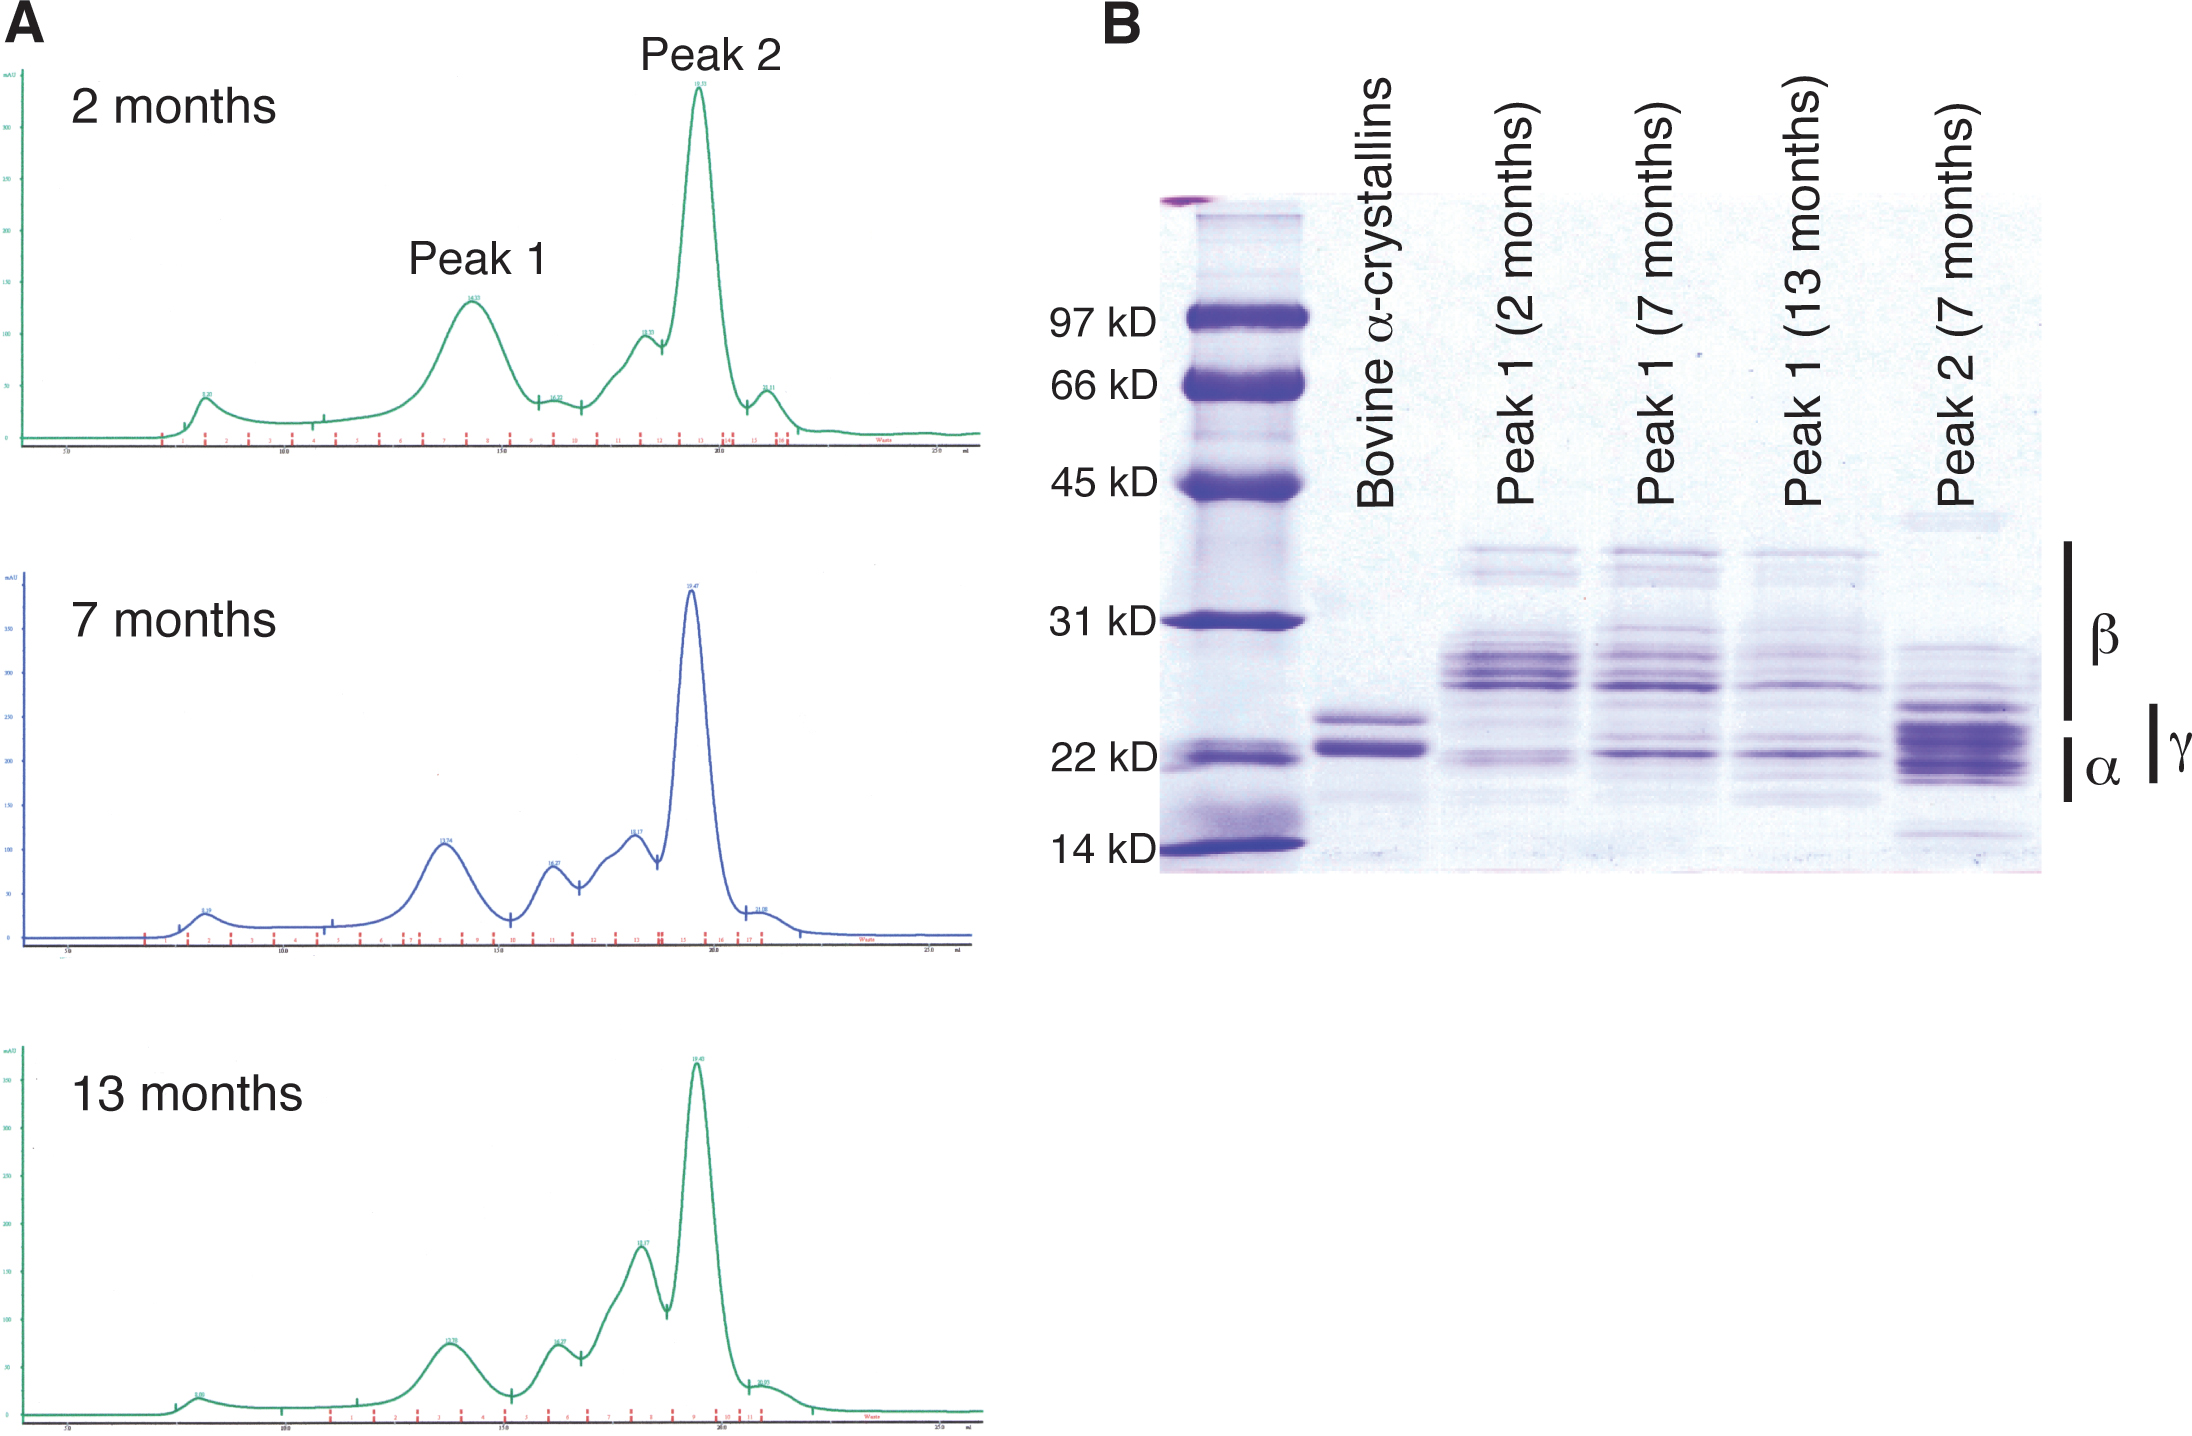
 Figure 5 of
Wages, Mol Vis 2013; 19:408-417.
Figure 5 of
Wages, Mol Vis 2013; 19:408-417.