Figure 4. Proportion of α-, β-, and γ-crystallins in the zebrafish lens at different ages. Percentages were calculated by measuring
the pixel densities of all spots for each crystallin family and comparing to the total protein content on two-dimensional
electrophoresis gels. Error bars indicate standard error of the mean (n=3).
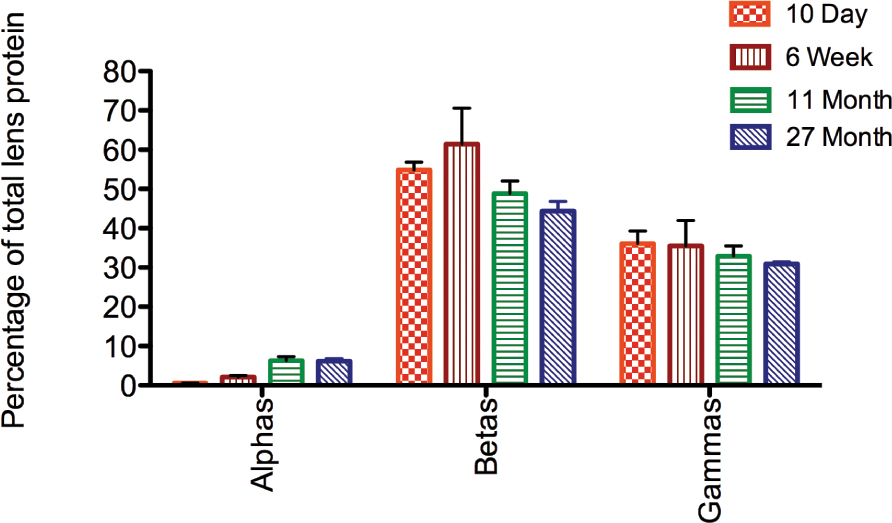
 Figure 4 of
Wages, Mol Vis 2013; 19:408-417.
Figure 4 of
Wages, Mol Vis 2013; 19:408-417.