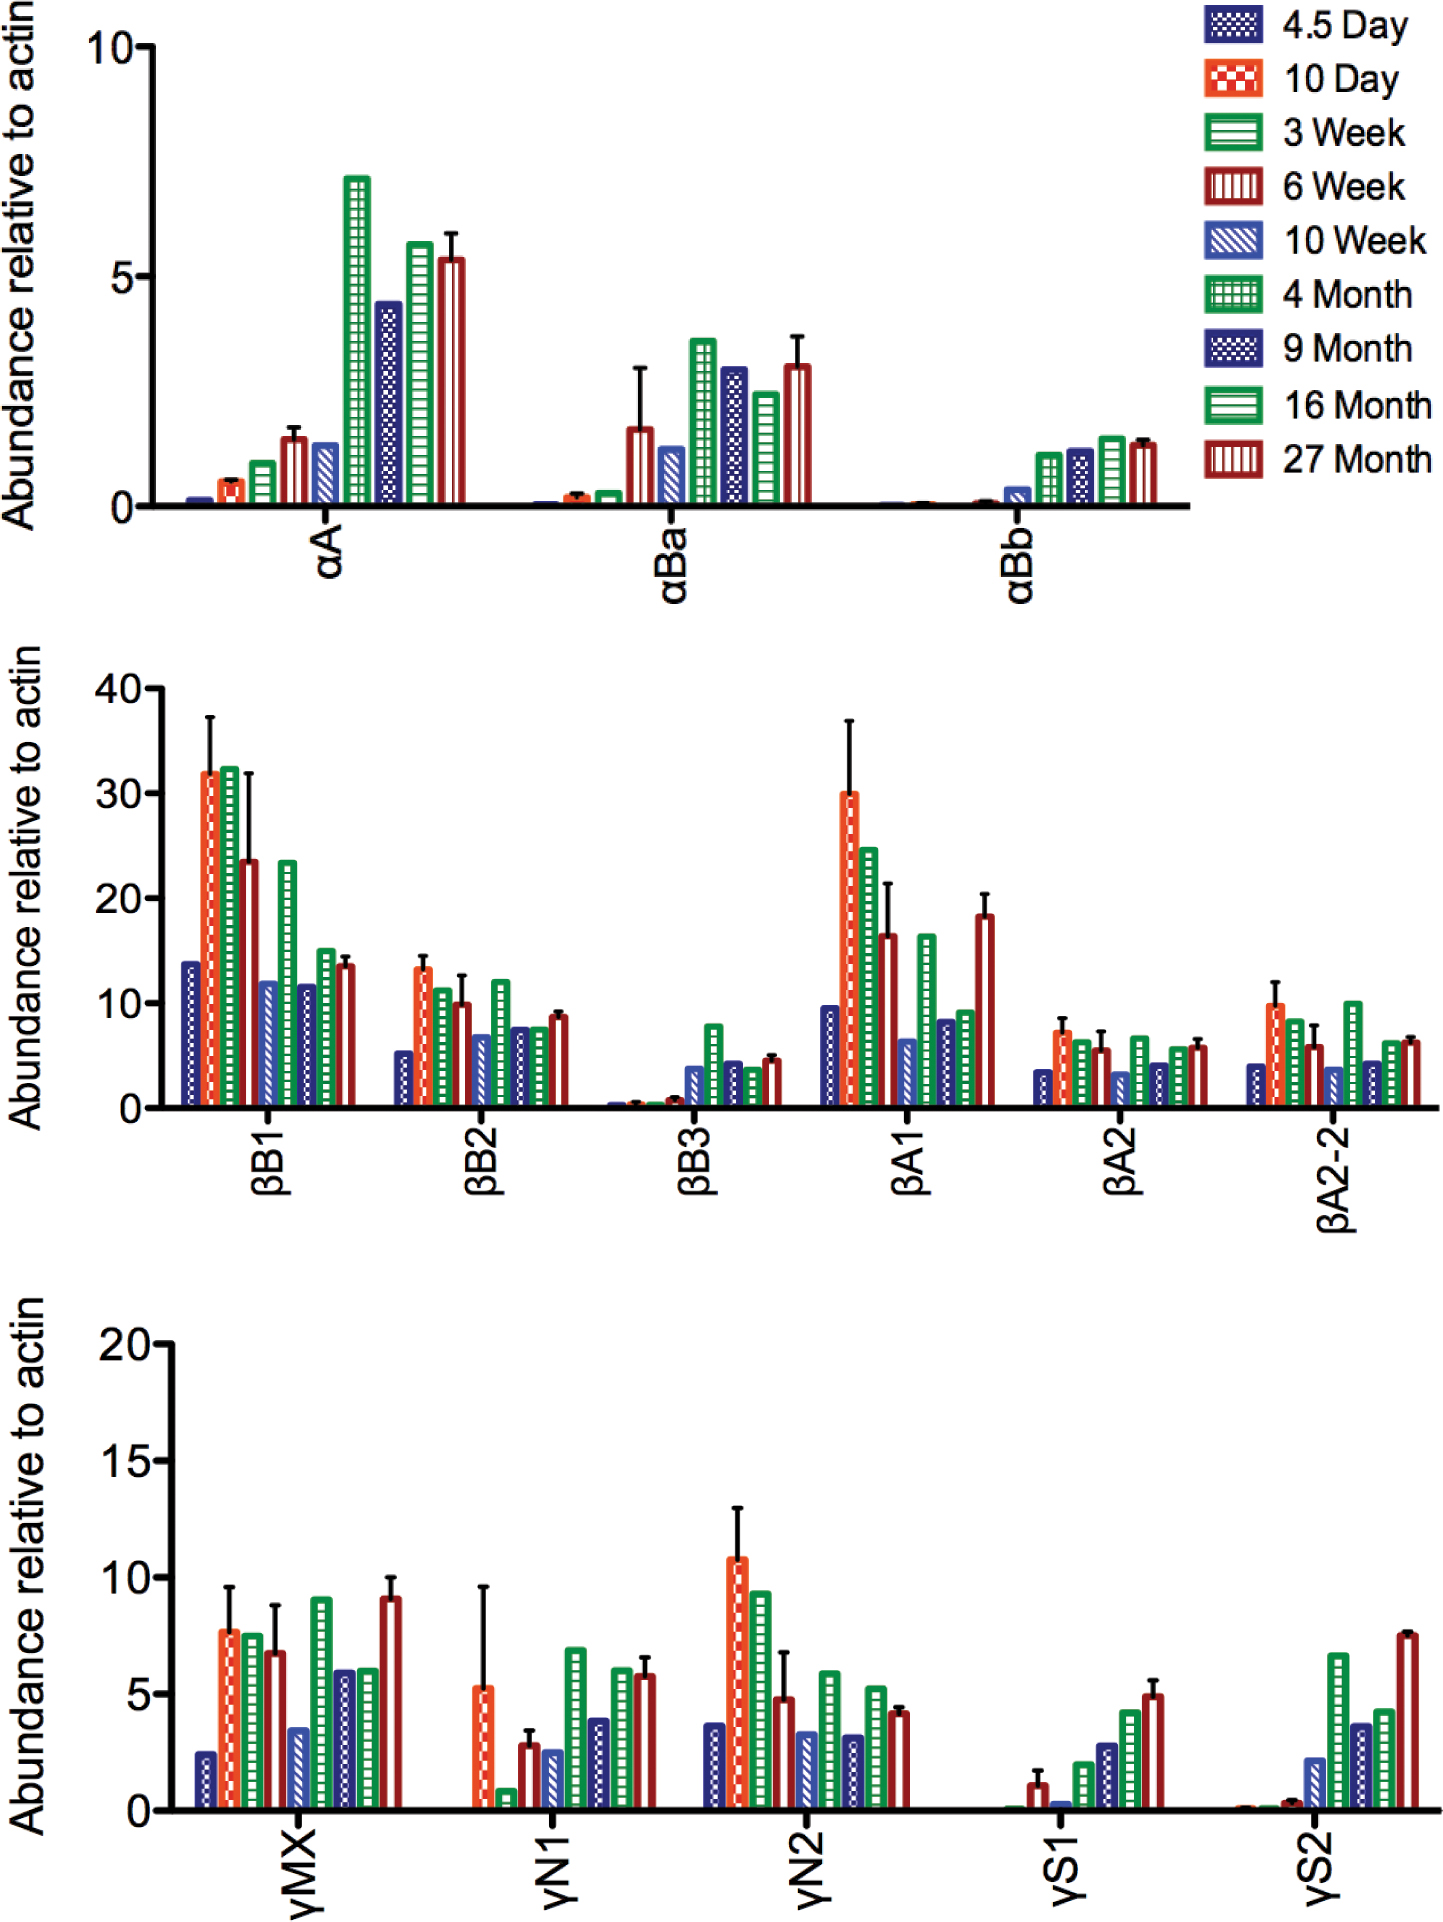
Figure 2. Abundance of select zebrafish lens crystallins at different ages indicates a shift in expression between 6 weeks and 4 months.
The proportional intensity of each crystallin spot was quantified by calculating its pixel density relative to actin. Error
bars for the 10-day, 6-week, and 27-month time points indicate standard error of the mean (n=3). Multiple crystallins show
a marked increase in expression between 6 weeks and 4 months of age.

 Figure 2 of
Wages, Mol Vis 2013; 19:408-417.
  Figure 2 of
Wages, Mol Vis 2013; 19:408-417.