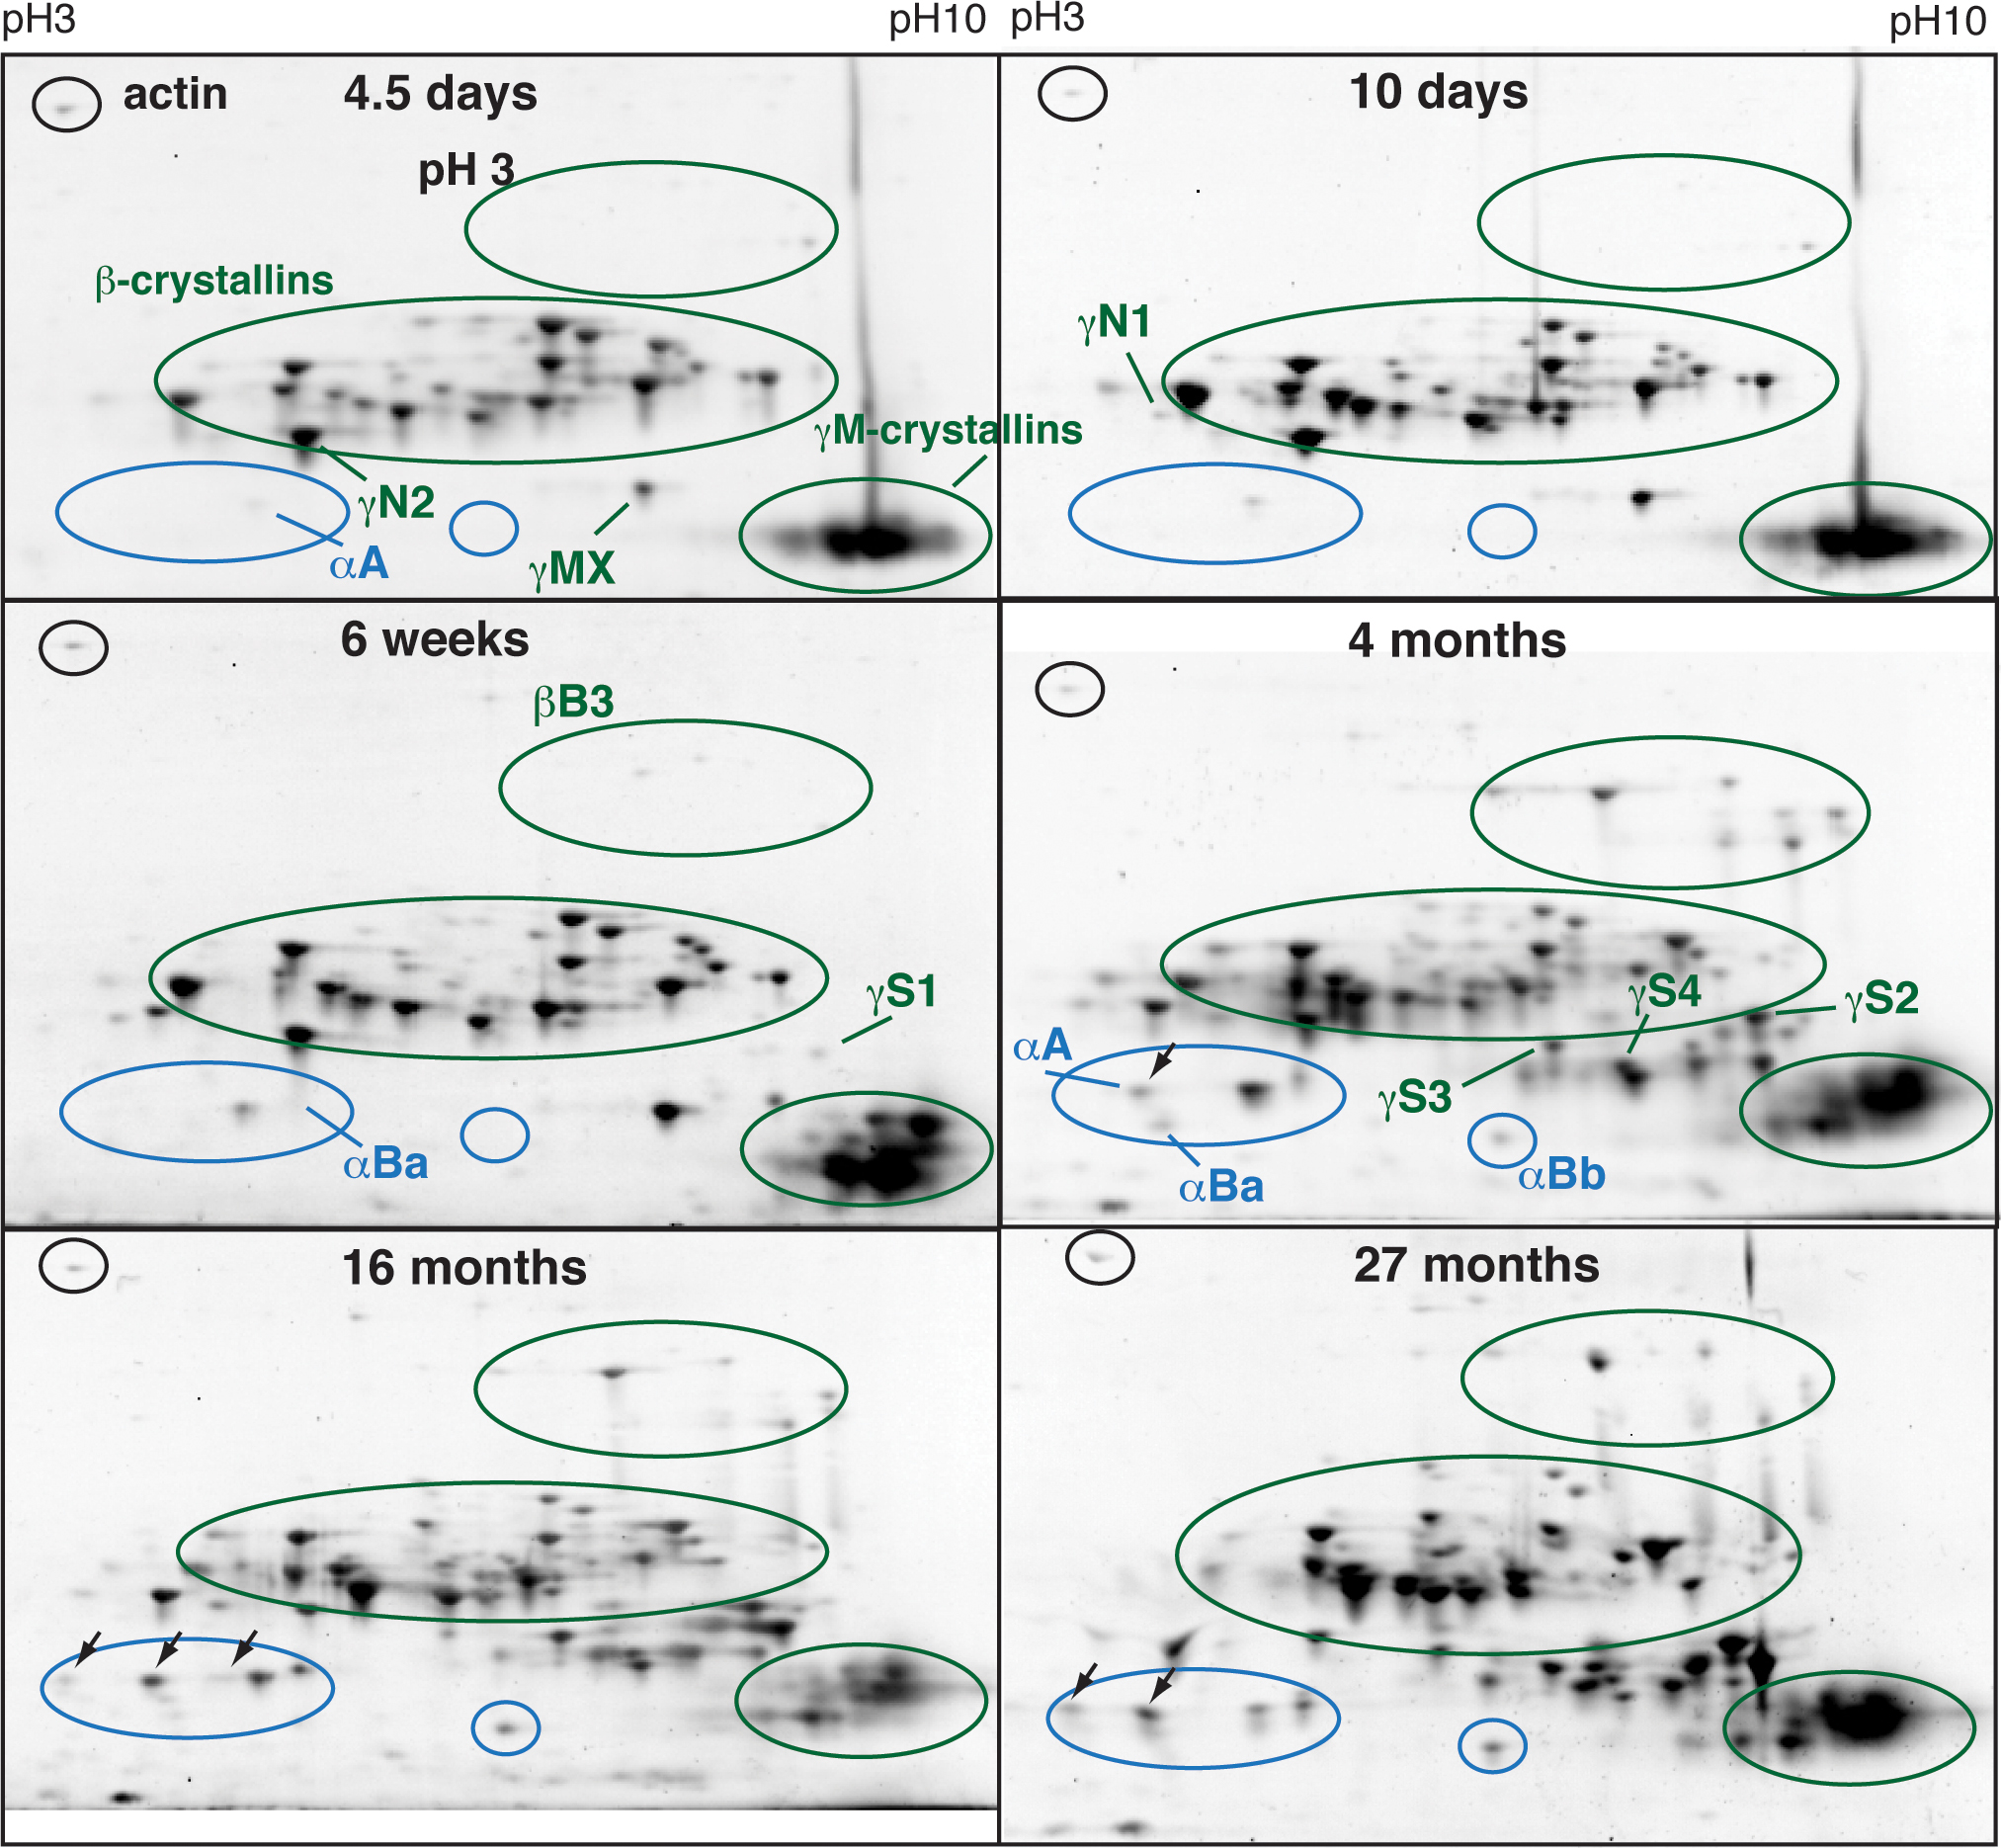
Figure 1. Two-dimensional gel electrophoresis of total zebrafish lens protein shows age-specific expression patterns. Separation was
performed on 11 cm pH gradient 3–10 nonlinear immobilized pH gradient strips. Ovals indicate the location of different crystallin
groups, and labels note their first appearance. Alpha-crystallins are shown in blue and β/γ-crystallins in green. Black arrows
indicate phosphorylated αA-crystallin [
31]. Spot identifications relied on previously published proteomics maps [
31] and were confirmed with matrix-assisted laser desorption/ionization time of flight (MALDI-TOF) mass spectrometry. Gels were
stained with SYPRO Ruby Red.
 Figure 1 of
Wages, Mol Vis 2013; 19:408-417.
Figure 1 of
Wages, Mol Vis 2013; 19:408-417.