 Appendix 5 of
Yuan, Mol Vis 2013; 19:374-383.
Appendix 5 of
Yuan, Mol Vis 2013; 19:374-383. Appendix 5 of
Yuan, Mol Vis 2013; 19:374-383.
Appendix 5.
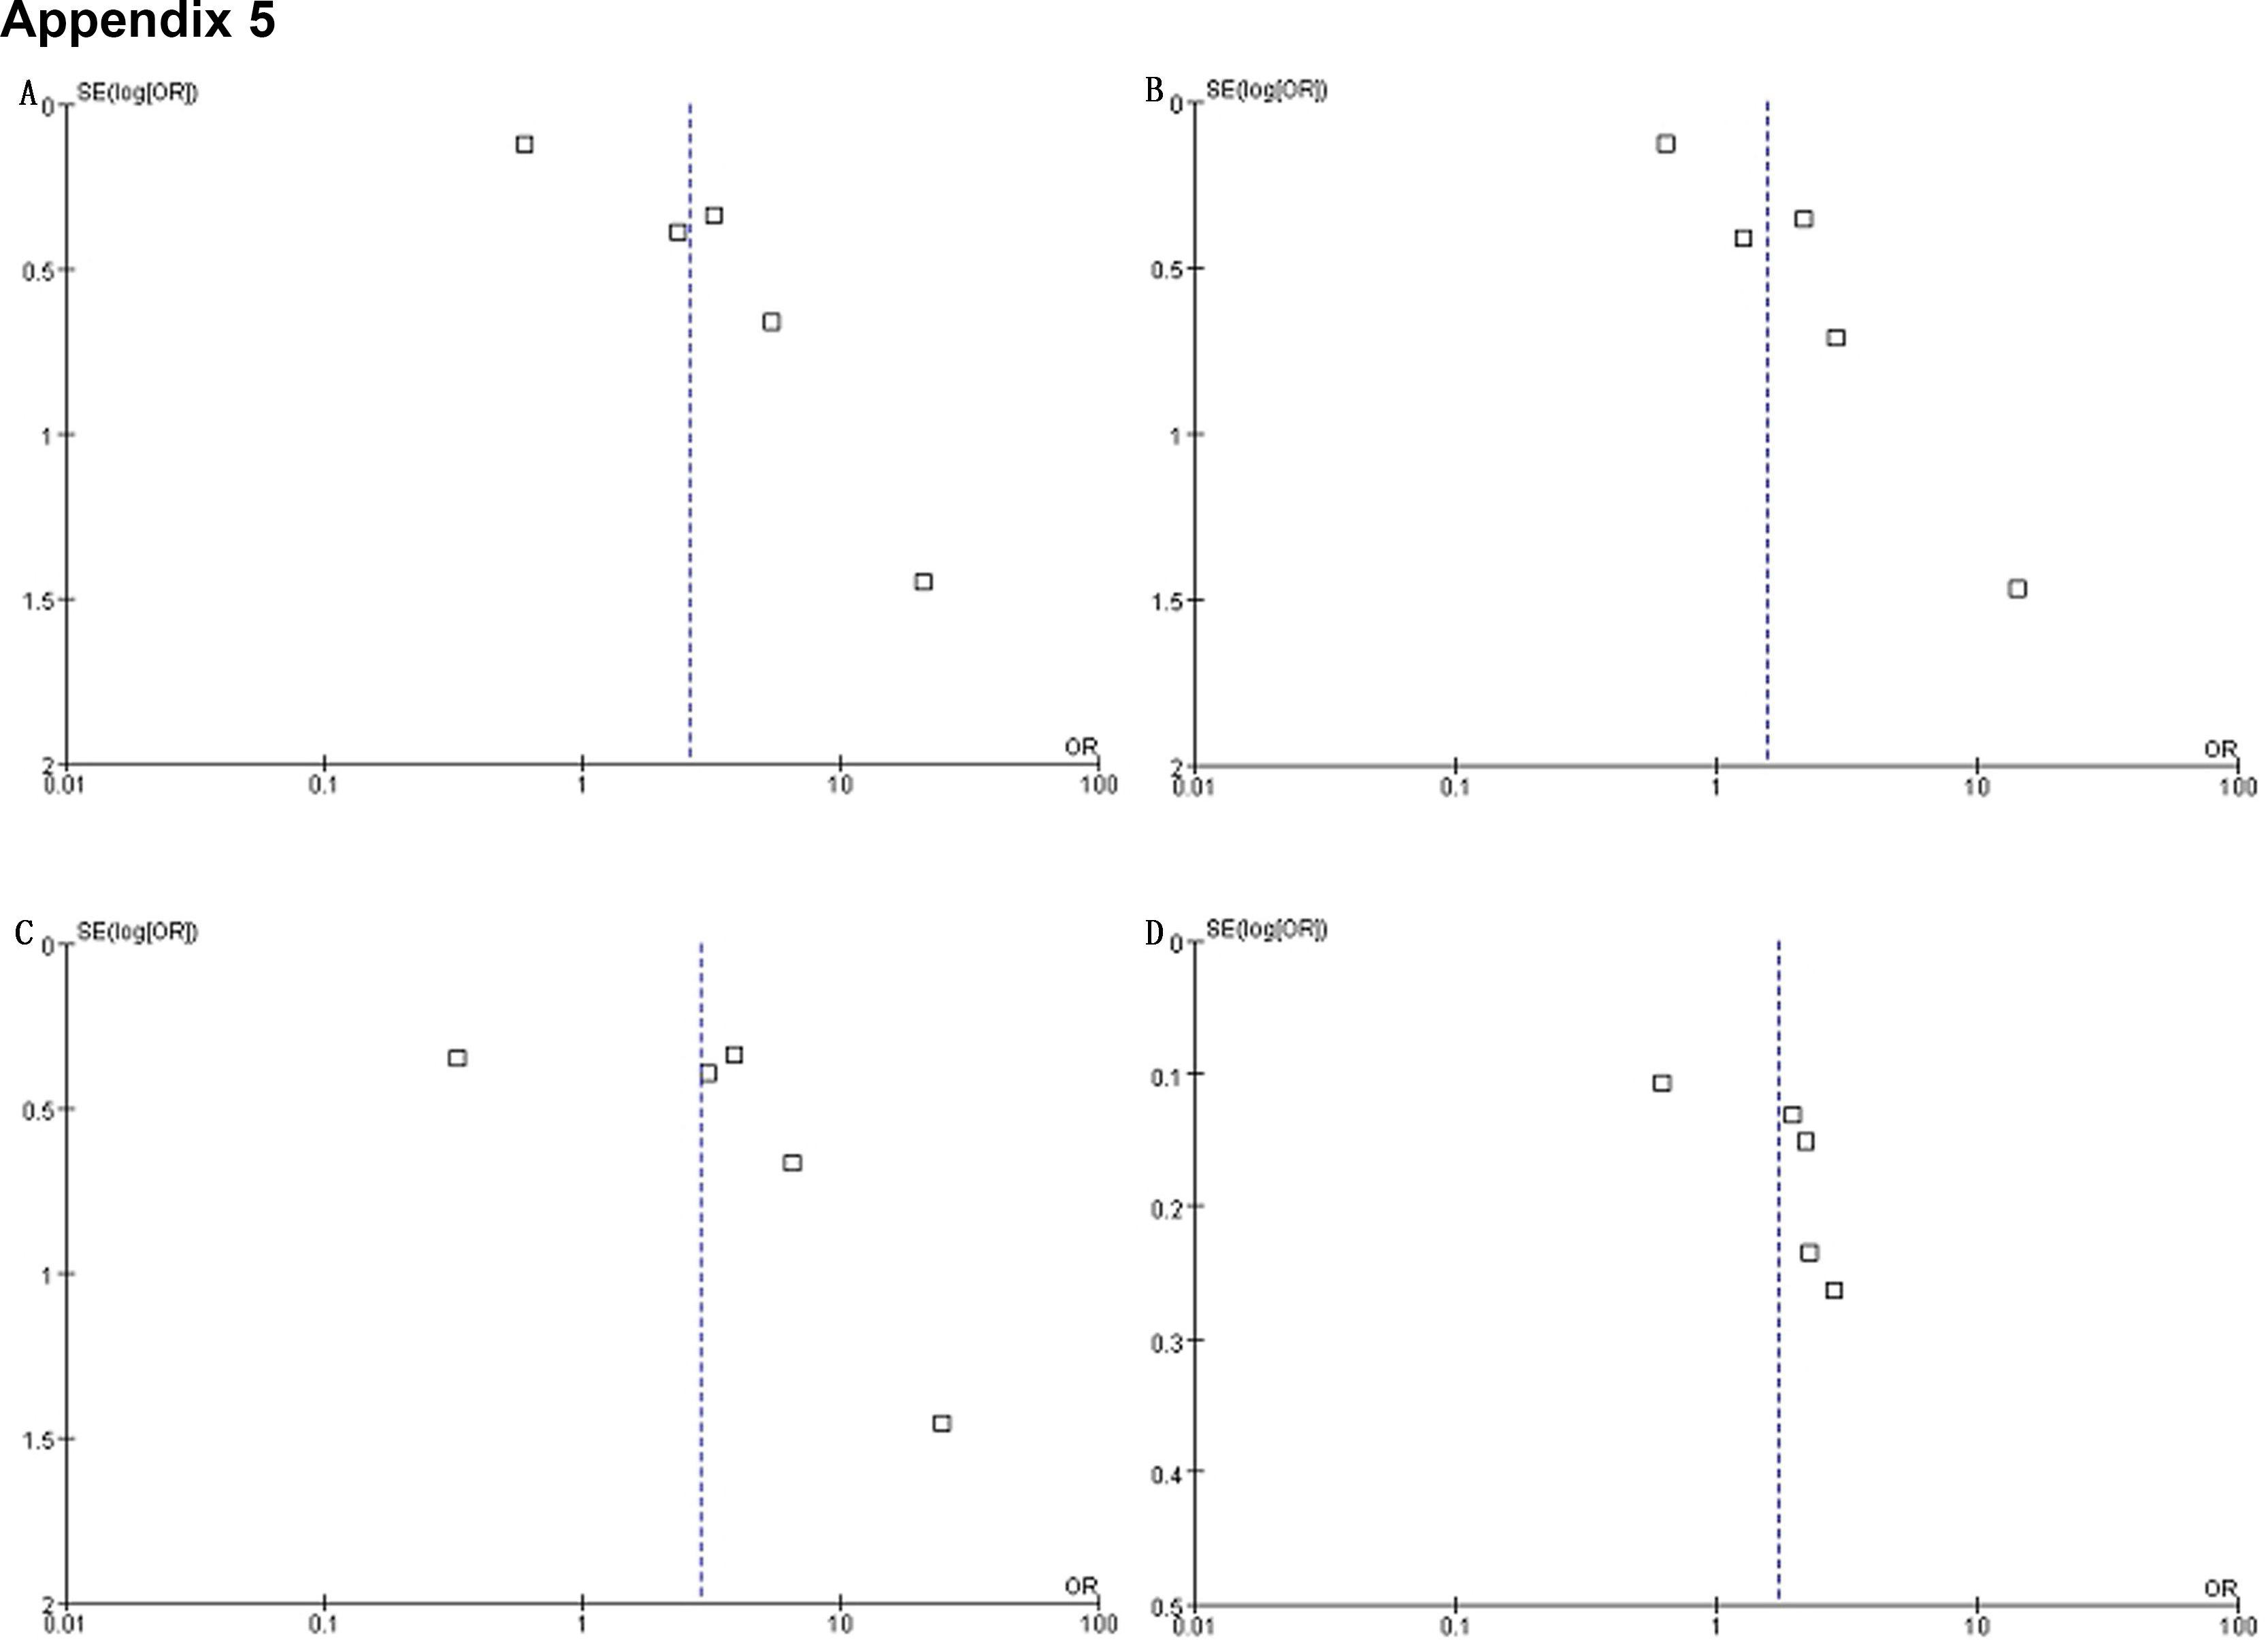
To access the data, click or select the words “Appendix 5.” The results of the funnel plots in all comparisons in Caucasion populations. A was in comparison of “GG+GA vs AA”; B was in comparison of “GA vs AA”; C was in comparison “GG vs AA”; and D was in comparison “G vs A”.