Figure 3. Rimonabant attenuates H2O2-induced cytotoxicity and apoptosis. A: Inhibition of the H2O2-induced decrease in RPE cell viability by rimonabant. RPE cells were pretreated with rimonabant (0 to 5 μM) for 15 min before
being exposed to H2O2 (200 μM) for 24 h, and cell viability was measured with the MTT assay. Values are the percentage of control (no H2O2, no rimonabant). *p<0.05 versus H2O2. B: RPE cells were pretreated with 1 μM ACEA for 15 min in the presence or absence of rimonabant (1 μM) before being exposed
to H2O2 (200 μM) for 24 h. *p<0.05 versus H2O2. **p<0.01 versus rimonabant without ACEA. C: Flow cytometric analysis of cell death with DMSO, H2O2 (200 μM), rimonabant (1 μM), and rimonabant (1 μM) + H2O2 (200 μM). Cells were treated with different media as indicated for 24 h. Summary of the results showing a significant increase
in apoptosis in RPE cells maintained in H2O2 (200 μM) compared with those maintained in vehicle. When the cells were incubated with rimonabant (1 μM), H2O2-induced apoptosis was significantly reduced. Treatment of RPE cells with rimonabant (1 μM) alone did not alter cell death.
*p<0.05 versus vehicle H2O2 (n=4). The statistical test of A and B are one way ANOVA, n=4 per group. In the C, the test is two way ANOVA, n=4 per group.
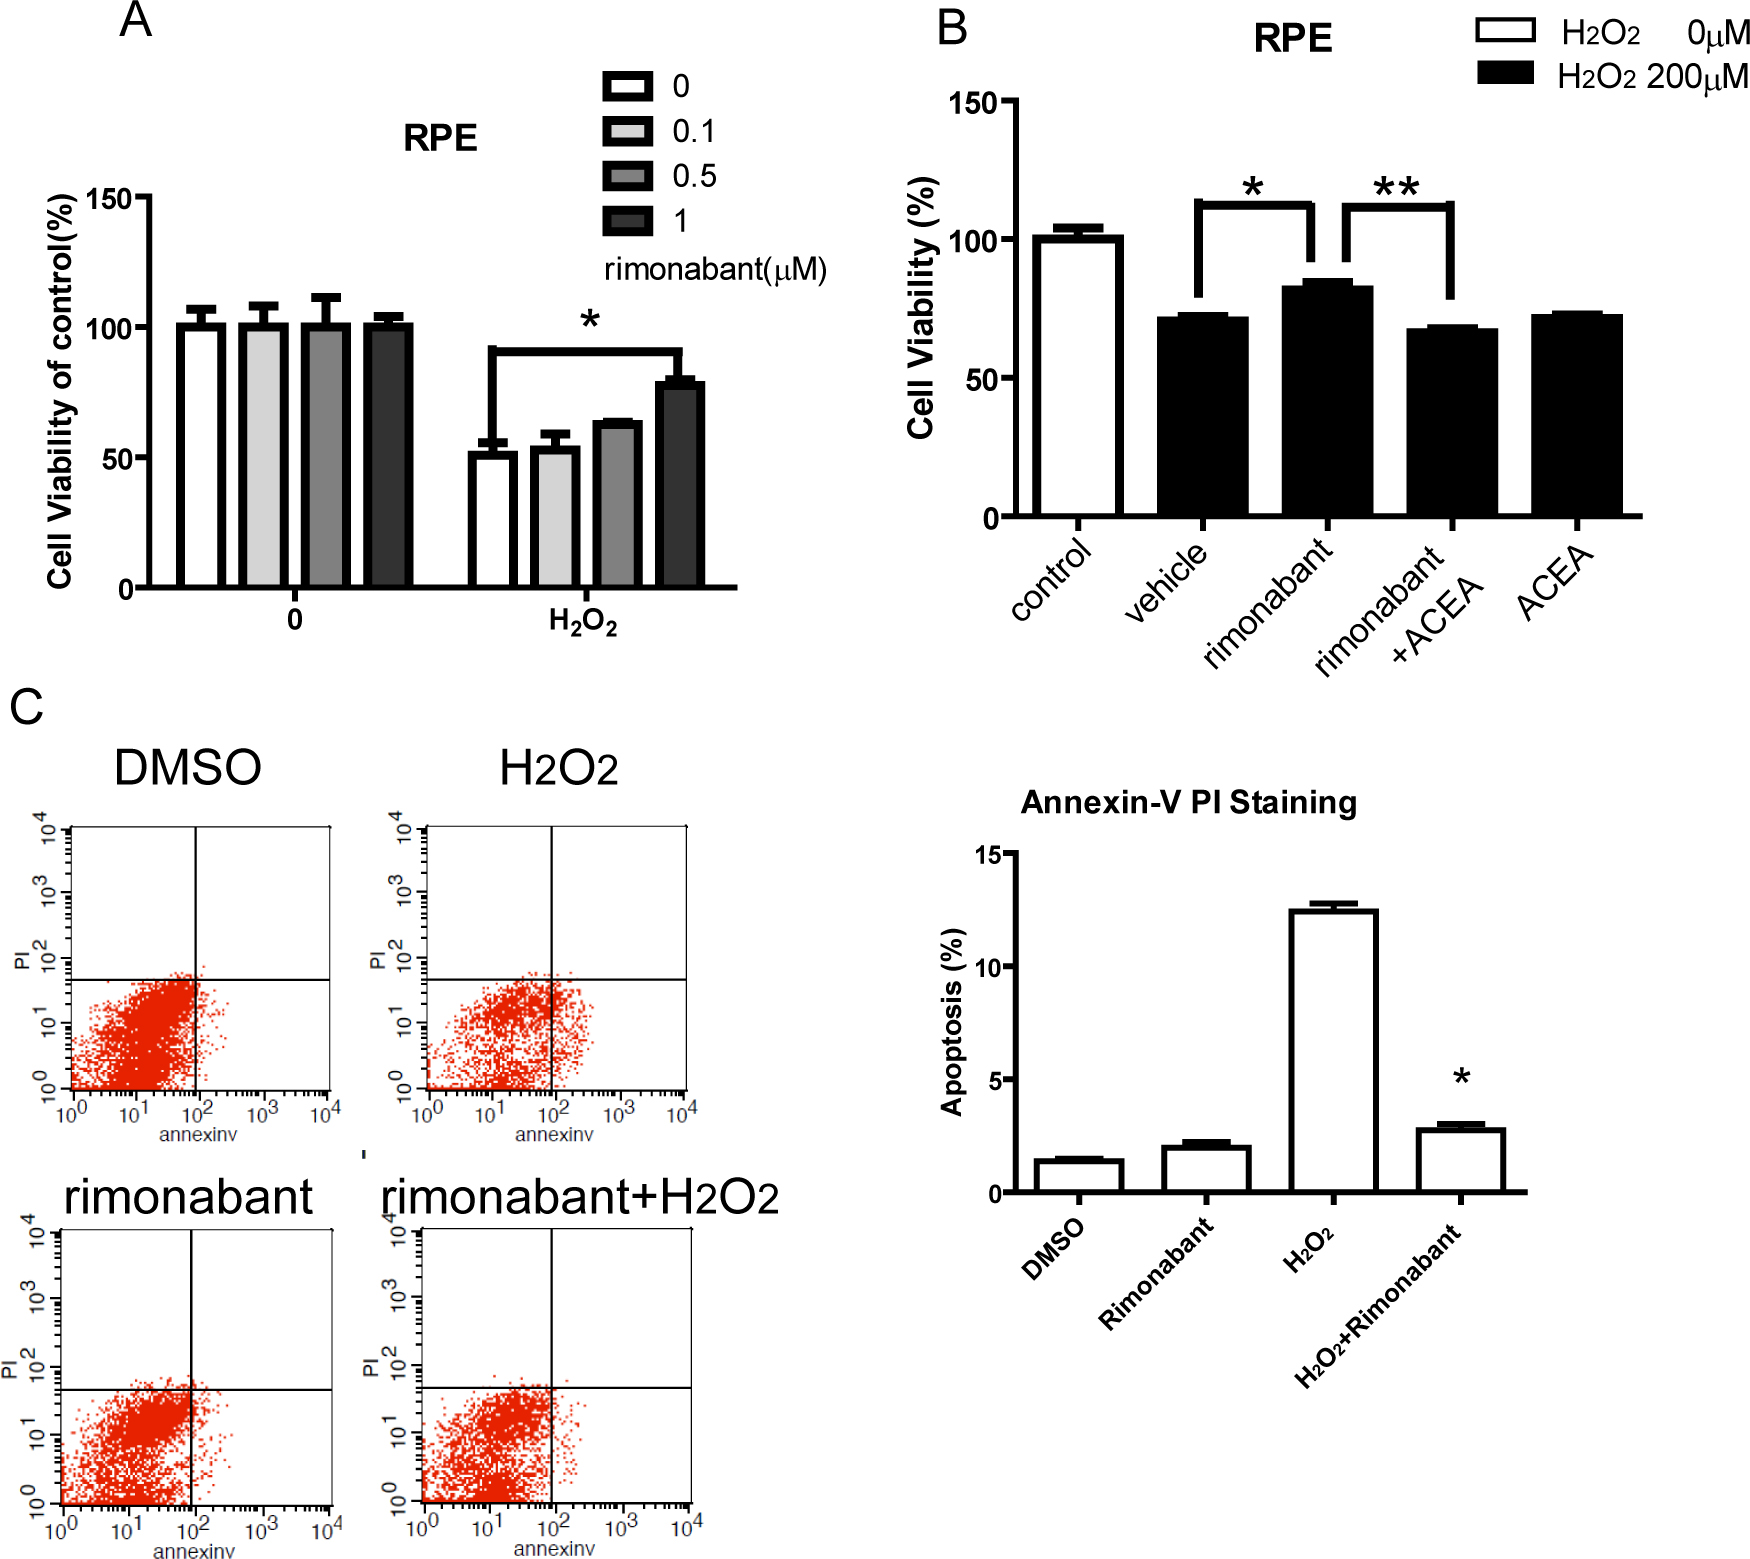
 Figure 3 of
Wei, Mol Vis 2013; 19:357-366.
Figure 3 of
Wei, Mol Vis 2013; 19:357-366.