Figure 4. Overview of the 185–220 kb
deletion on chromosome band Xp22.2 from the mother and the
proband. Data shown are from the proband. Genes in and
surrounding this region are shown at the bottom. The HCCS gene
is highlighted in red; all other coding genes in the proximity
are shown in blue. Noncoding sequences such as long noncoding
RNAs are given in gray. Genomic coordinates are given in GRCh37
(hg build 19).
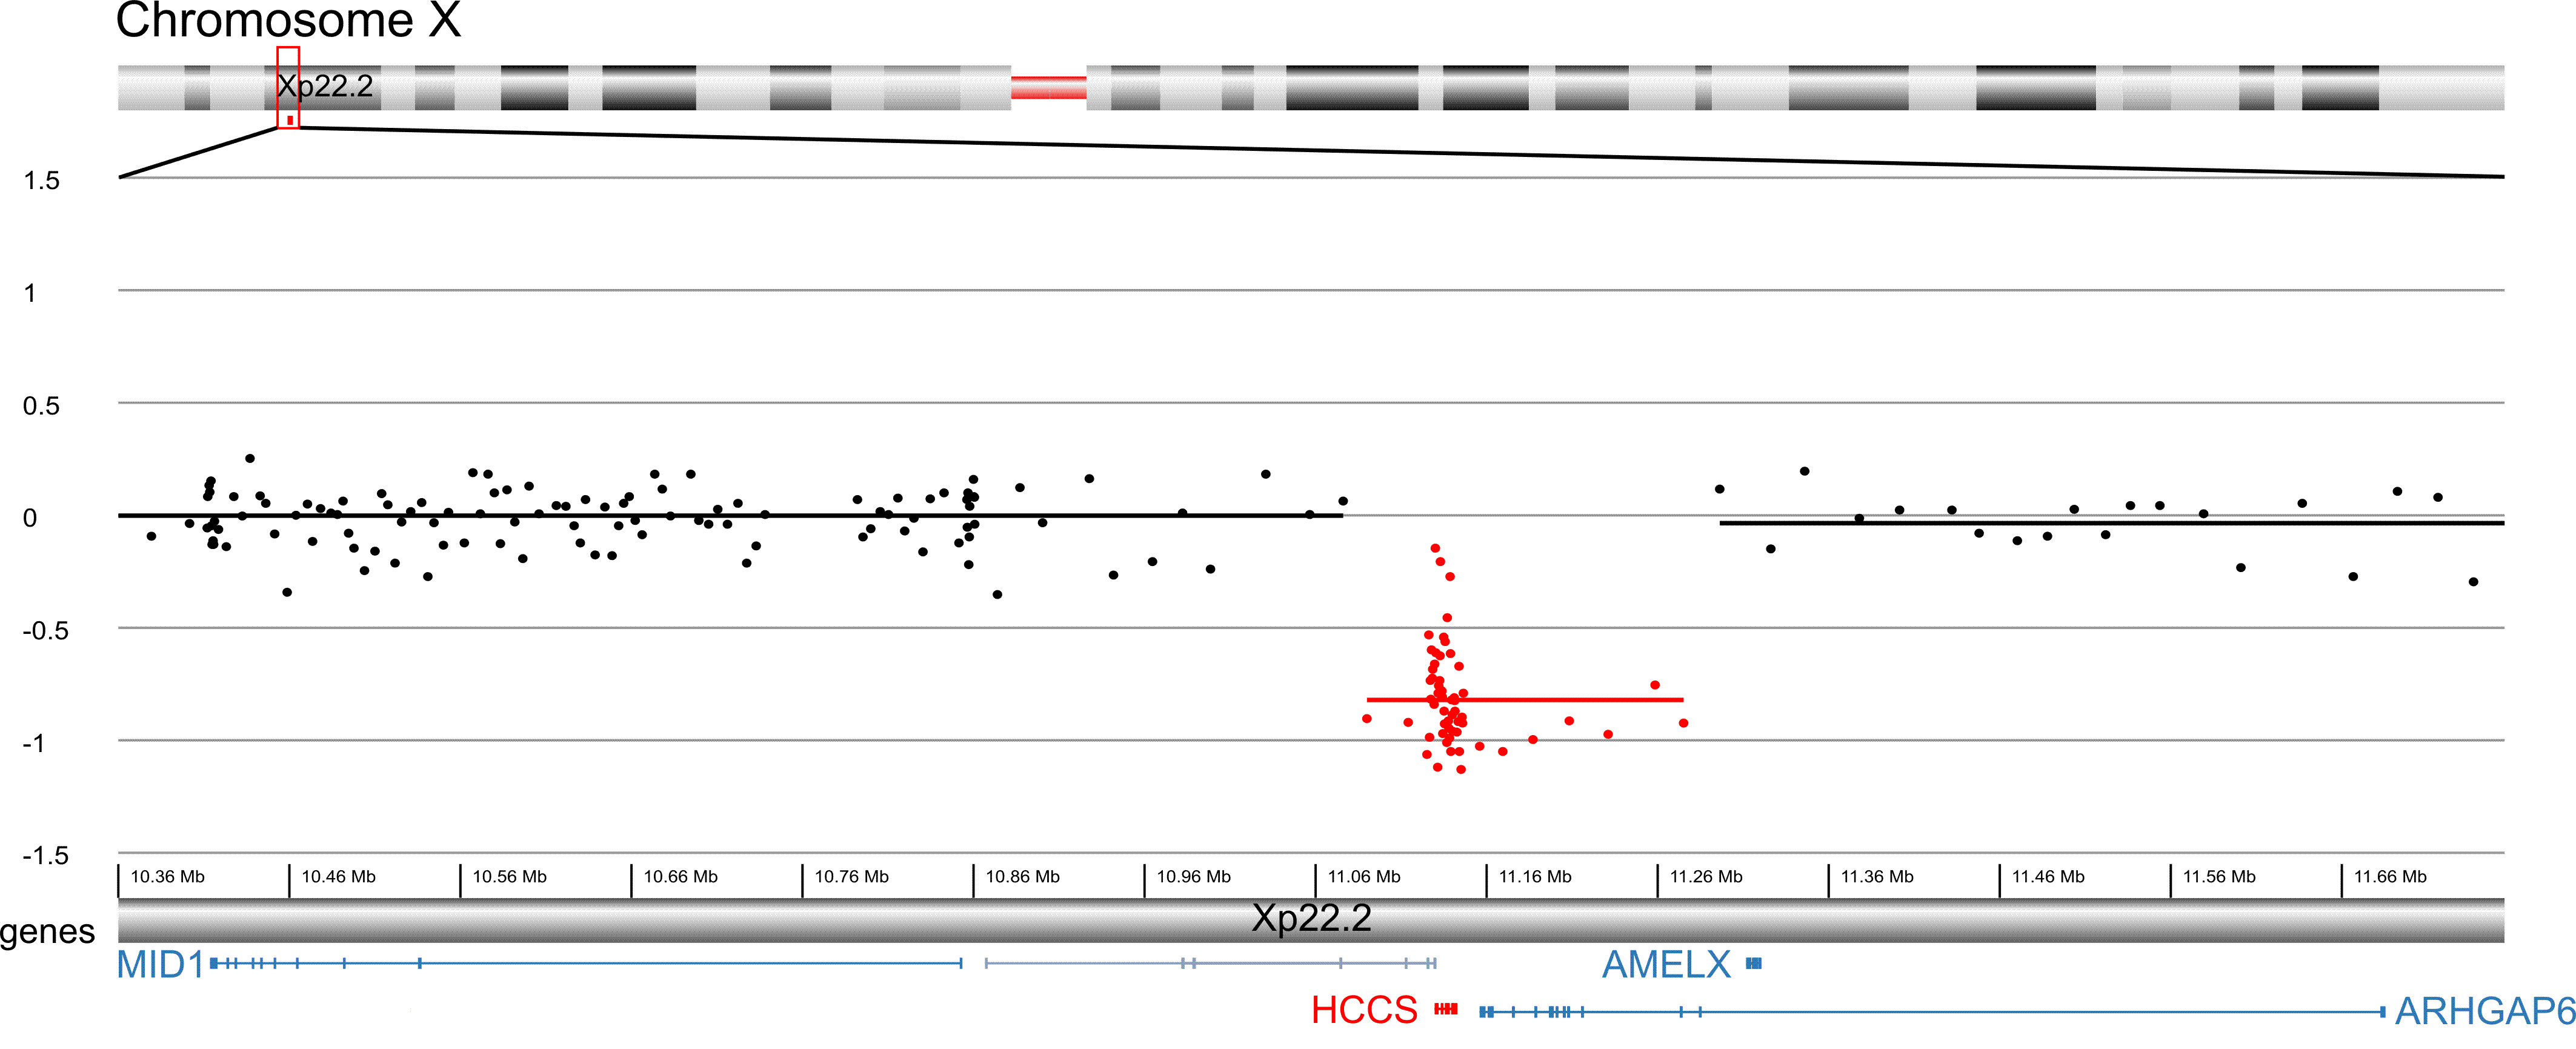
 Figure 4
of Vergult, Mol Vis 2013; 19:311-318.
Figure 4
of Vergult, Mol Vis 2013; 19:311-318.