Figure 3. Induction of pentraxin 3 (PTX3) mRNA expression by interleukin 1 beta (IL-1β) and tumor necrosis factor alpha (TNF-α) in human
RPE cells. Total RNA was extracted from ARPE-19 cells after various doses of IL-1β (A) or TNF-α (B) were administered after 24 h. The expression of the PTX3 mRNA levels was assessed with real-time RT–PCR analysis. These experiments were performed at three independent times. Expression
levels of PTX3 is divided by expression of the control gene, ACTB, and shown as a ratio of PTX3/ACTB. *p<0.05 upregulation in IL-1β (A) or TNF-α (B) treatment versus no IL-1β or TNF-α. For PTX3 mRNA, expression was normalized by an internal control gene, β -actin, and shown as a fold increase. For the real-time PCR
experiments, values are presented as mean±SD, n=3.
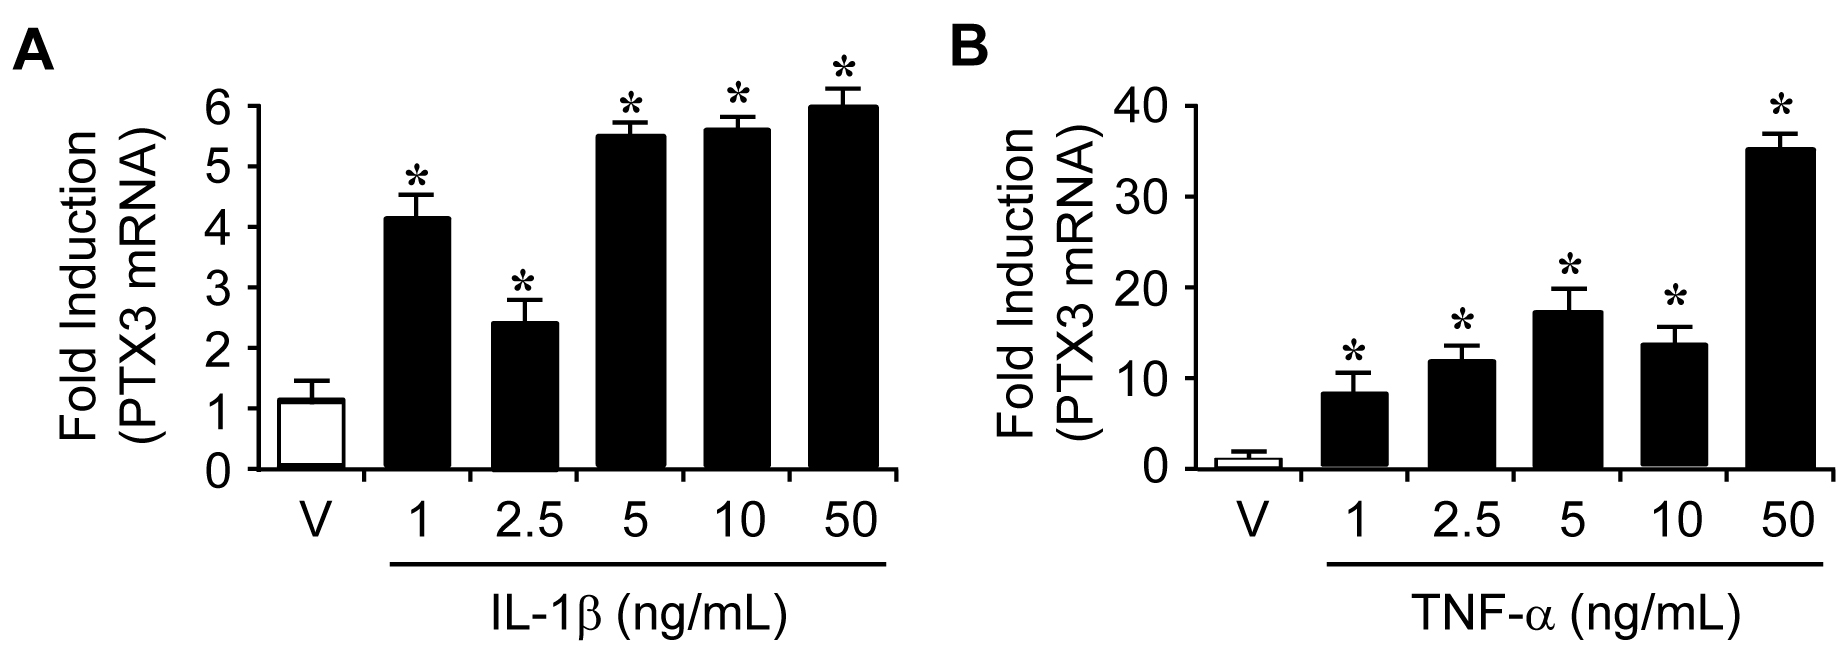
 Figure 3 of
Woo, Mol Vis 2013; 19:303-310.
Figure 3 of
Woo, Mol Vis 2013; 19:303-310.