Figure 1. Sequence chromatograms. The 11 sequence changes detected in the probands with dominant optic atrophy are shown (left column)
compared with corresponding normal sequences (right column). The mutational sites are indicated with an arrow, and the amino
acid codes are depicted with a line.
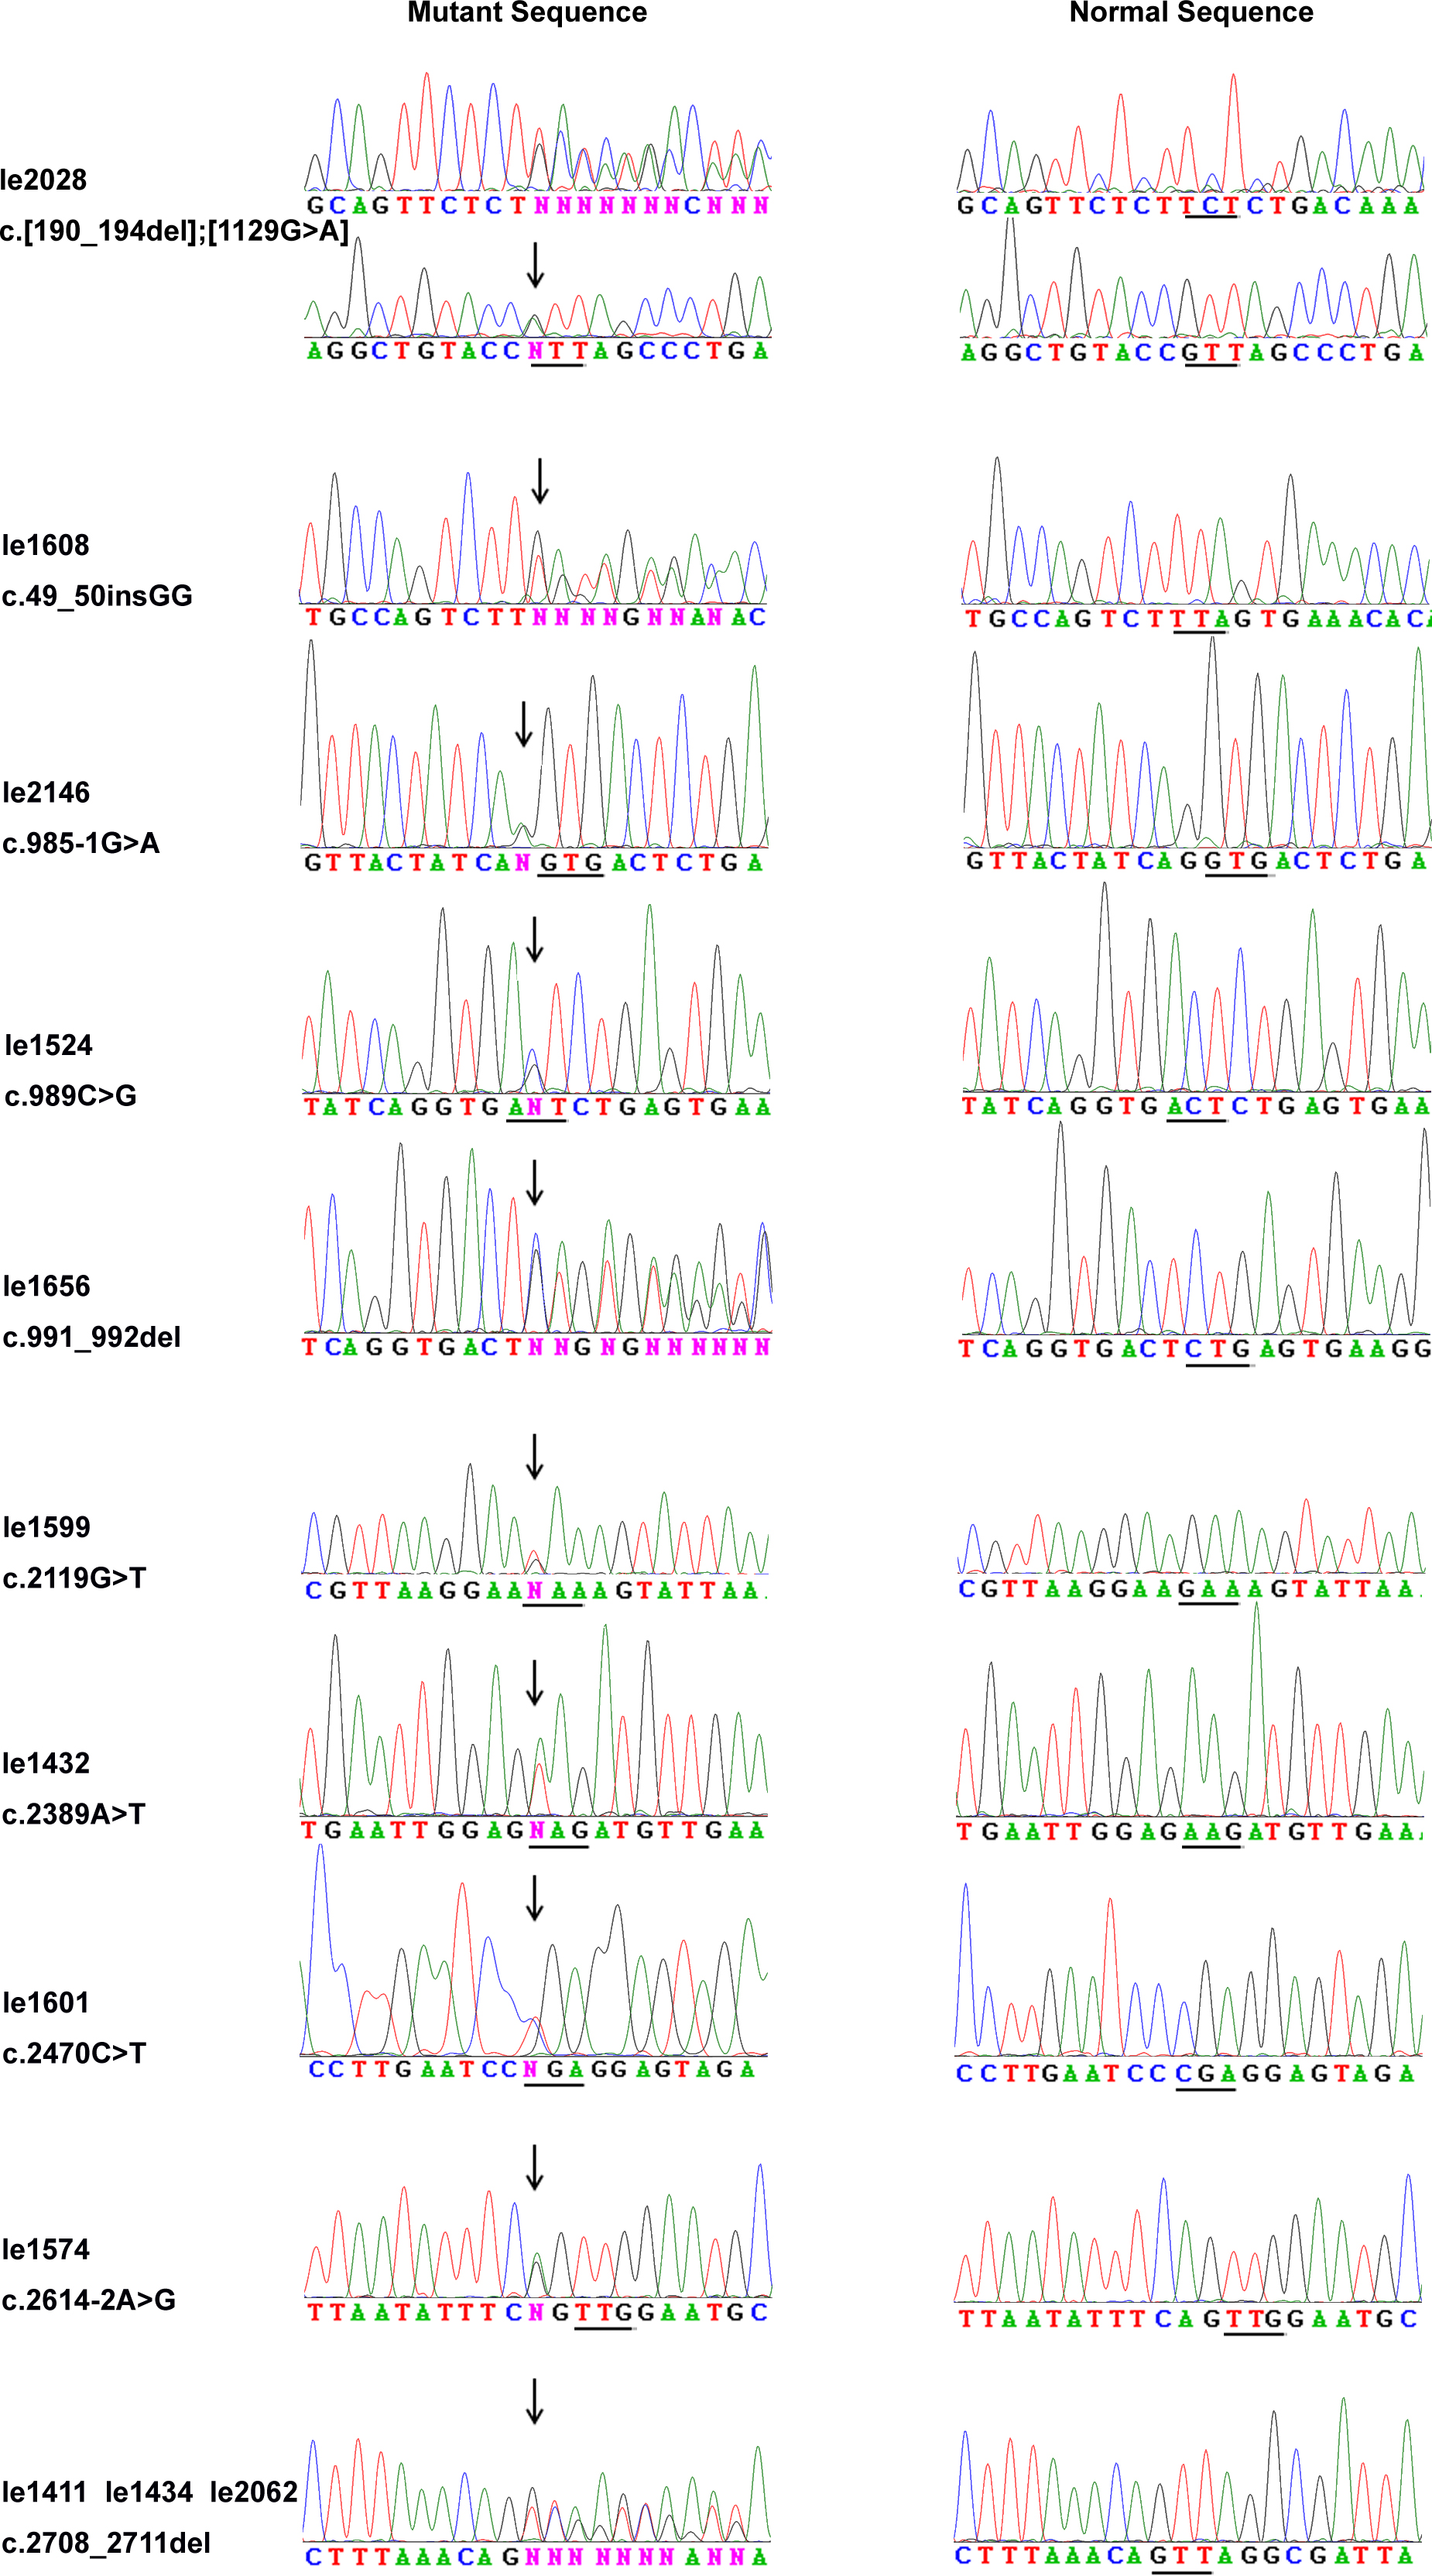
 Figure 1 of
Chen, Mol Vis 2013; 19:292-302.
Figure 1 of
Chen, Mol Vis 2013; 19:292-302.