Figure 1. Pirfenidone (PFD) inhibited cell migration. The width of the remaining defect in the control cells was significantly narrower
than in cells treated with PFD. A: Light microscope image at the initial time point was taken (i); Light microscope image at 24 h for control cells in serum-free
medium was taken (ii); Light microscope image at 24 h for cells treated with 0.3 mg/ml PFD was taken (iii); Light microscope
image at 24 h for cells treated with 0.5 mg/ml PFD was taken (iv). B: Summary of three experiments in which the widths of remaining defects were measured in duplicate. The distance between the
cell fronts in initial area was set to 100. The widths of the remaining defect after treatment at 24 h were analyzed. Samples
significantly different the control sample were indicated with symbols (**n=3, the error bar indicates standard deviation
[SD], p<0.01, relative to control).
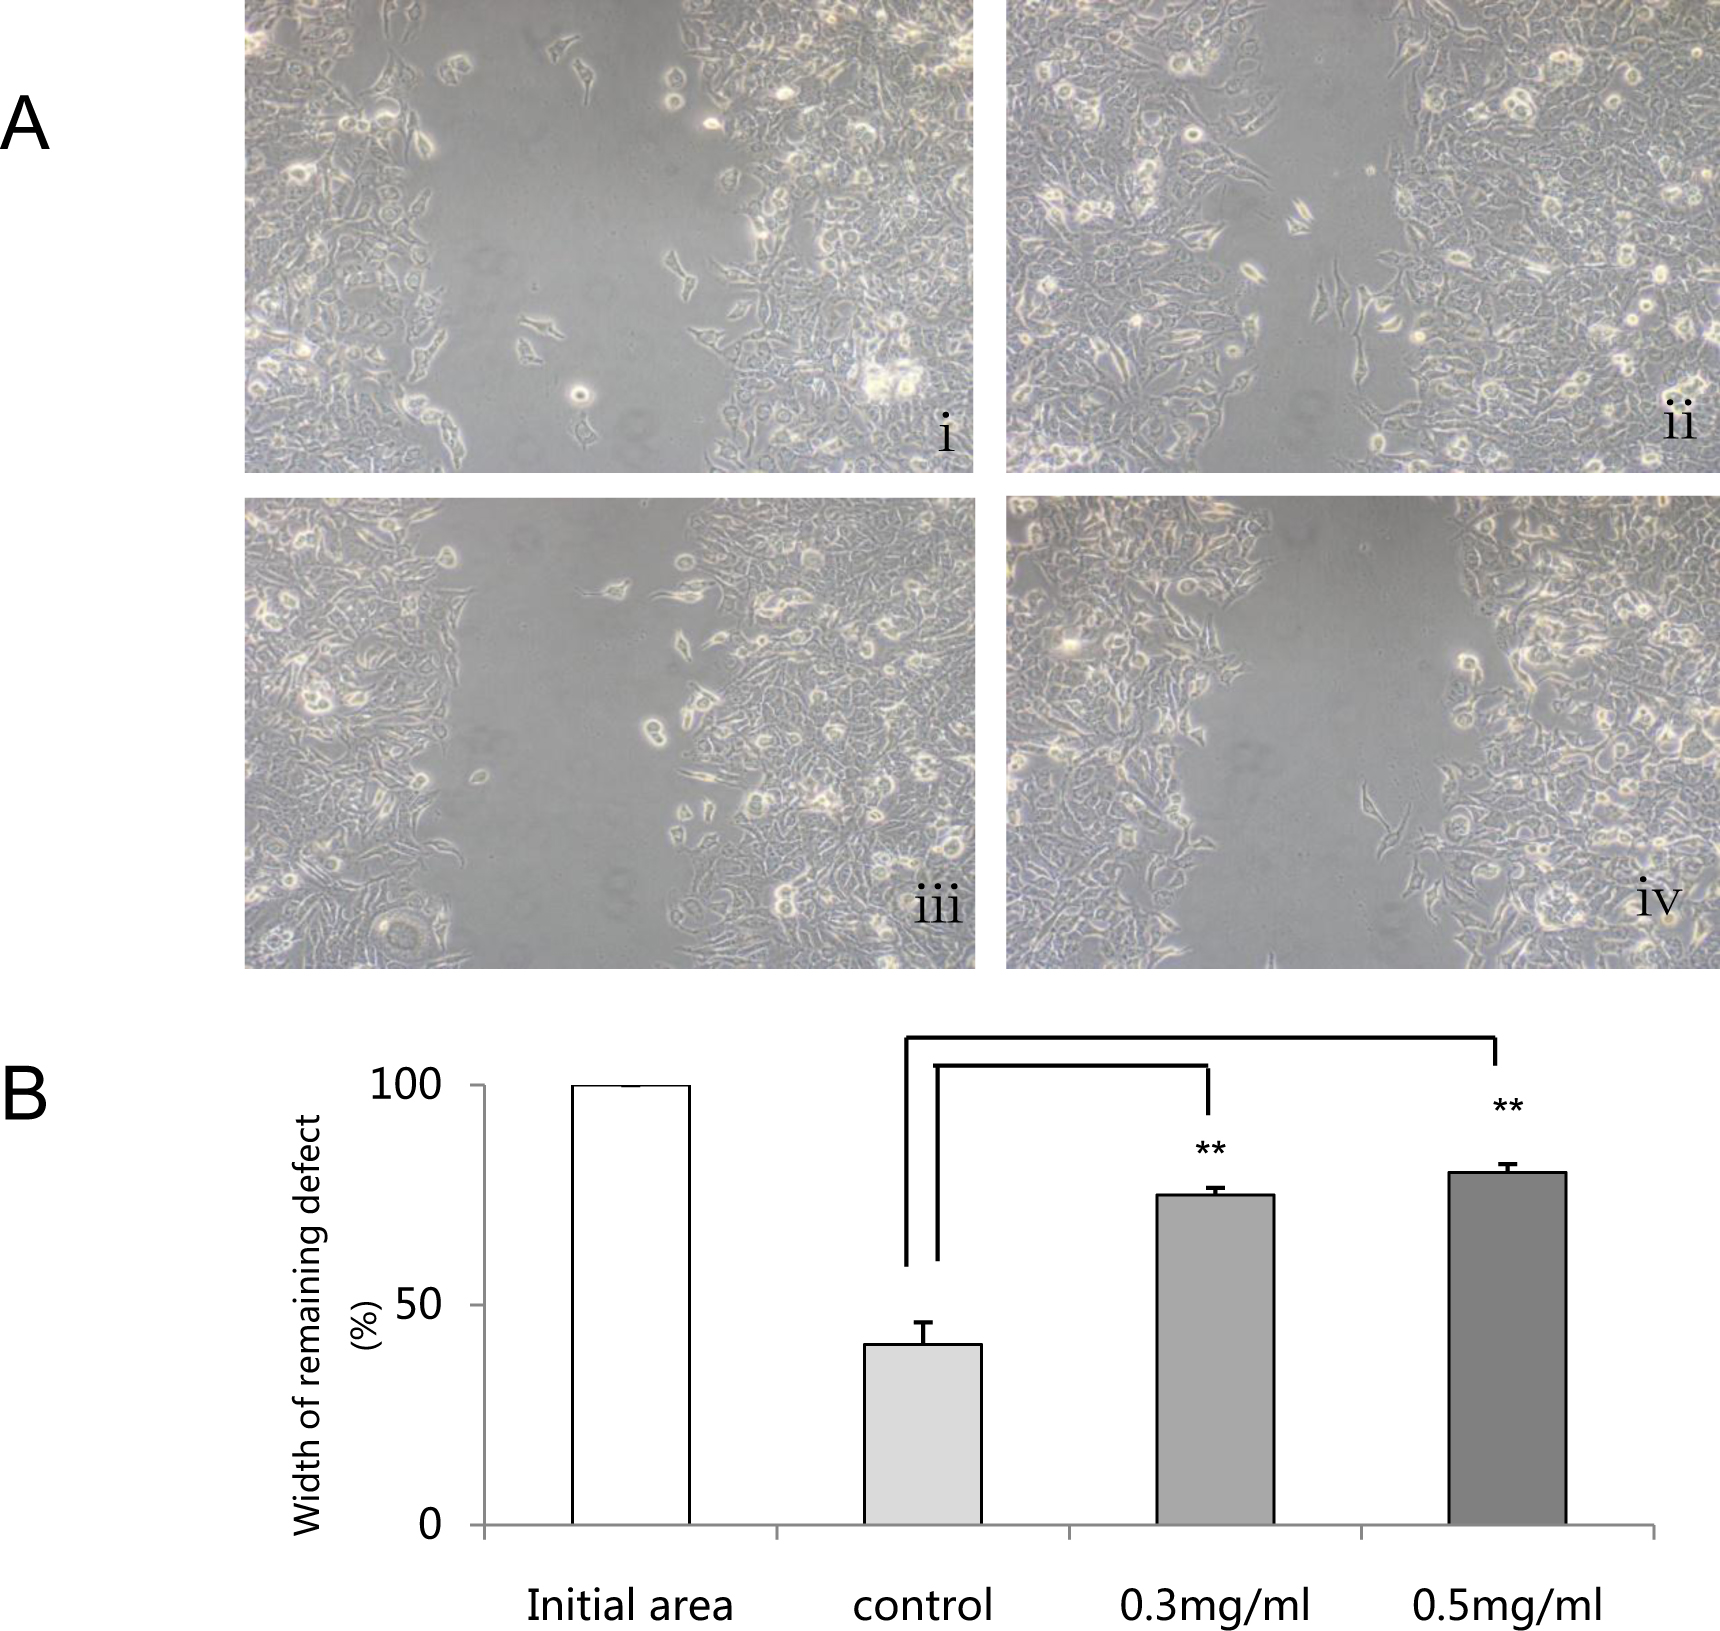
 Figure 1 of
Wang, Mol Vis 2013; 19:2626-2635.
Figure 1 of
Wang, Mol Vis 2013; 19:2626-2635.