Figure 2. Th1 and Th17 cells in peripheral blood mononuclear cells stimulated with ocular and control lysates. A: Scatterplots showing the percentages of interleukin (IL)-17 CD4+, CD3+, and interferon (IFN)-γ+ CD4+, CD3+ T cells in peripheral blood monocytes cultures stimulated for 6 days with ocular and control lysates, for each birdshot chorioretinopathy
(BSCR) subgroup and the control group. Each circle represents a patient or control as indicated in the upper right legend.
Horizontal lines indicate the geometric mean. B: Representative flow cytometric plots of a healthy control, a patient with a current or past history of immunomodulatory
therapy (IMT), or inactive disease (birdshot inactive/IMT) and a patient naïve to immunomodulatory therapy (birdshot active/naïve).
Cells were gated on CD3+, CD4+ lymphocytes. Skin=protein lysate derived from a skin biopsy of two healthy unrelated controls. Retina=protein lysate derived
from retinas of two healthy unrelated controls. Choroid=protein lysate derived from choroid of two healthy unrelated controls.
Statistical analysis was performed using Kruskal-Wallis test with Dunn's multiple-comparison post-hoc test. *=p<0.05, **=p<0.01,
***=p<0.001.
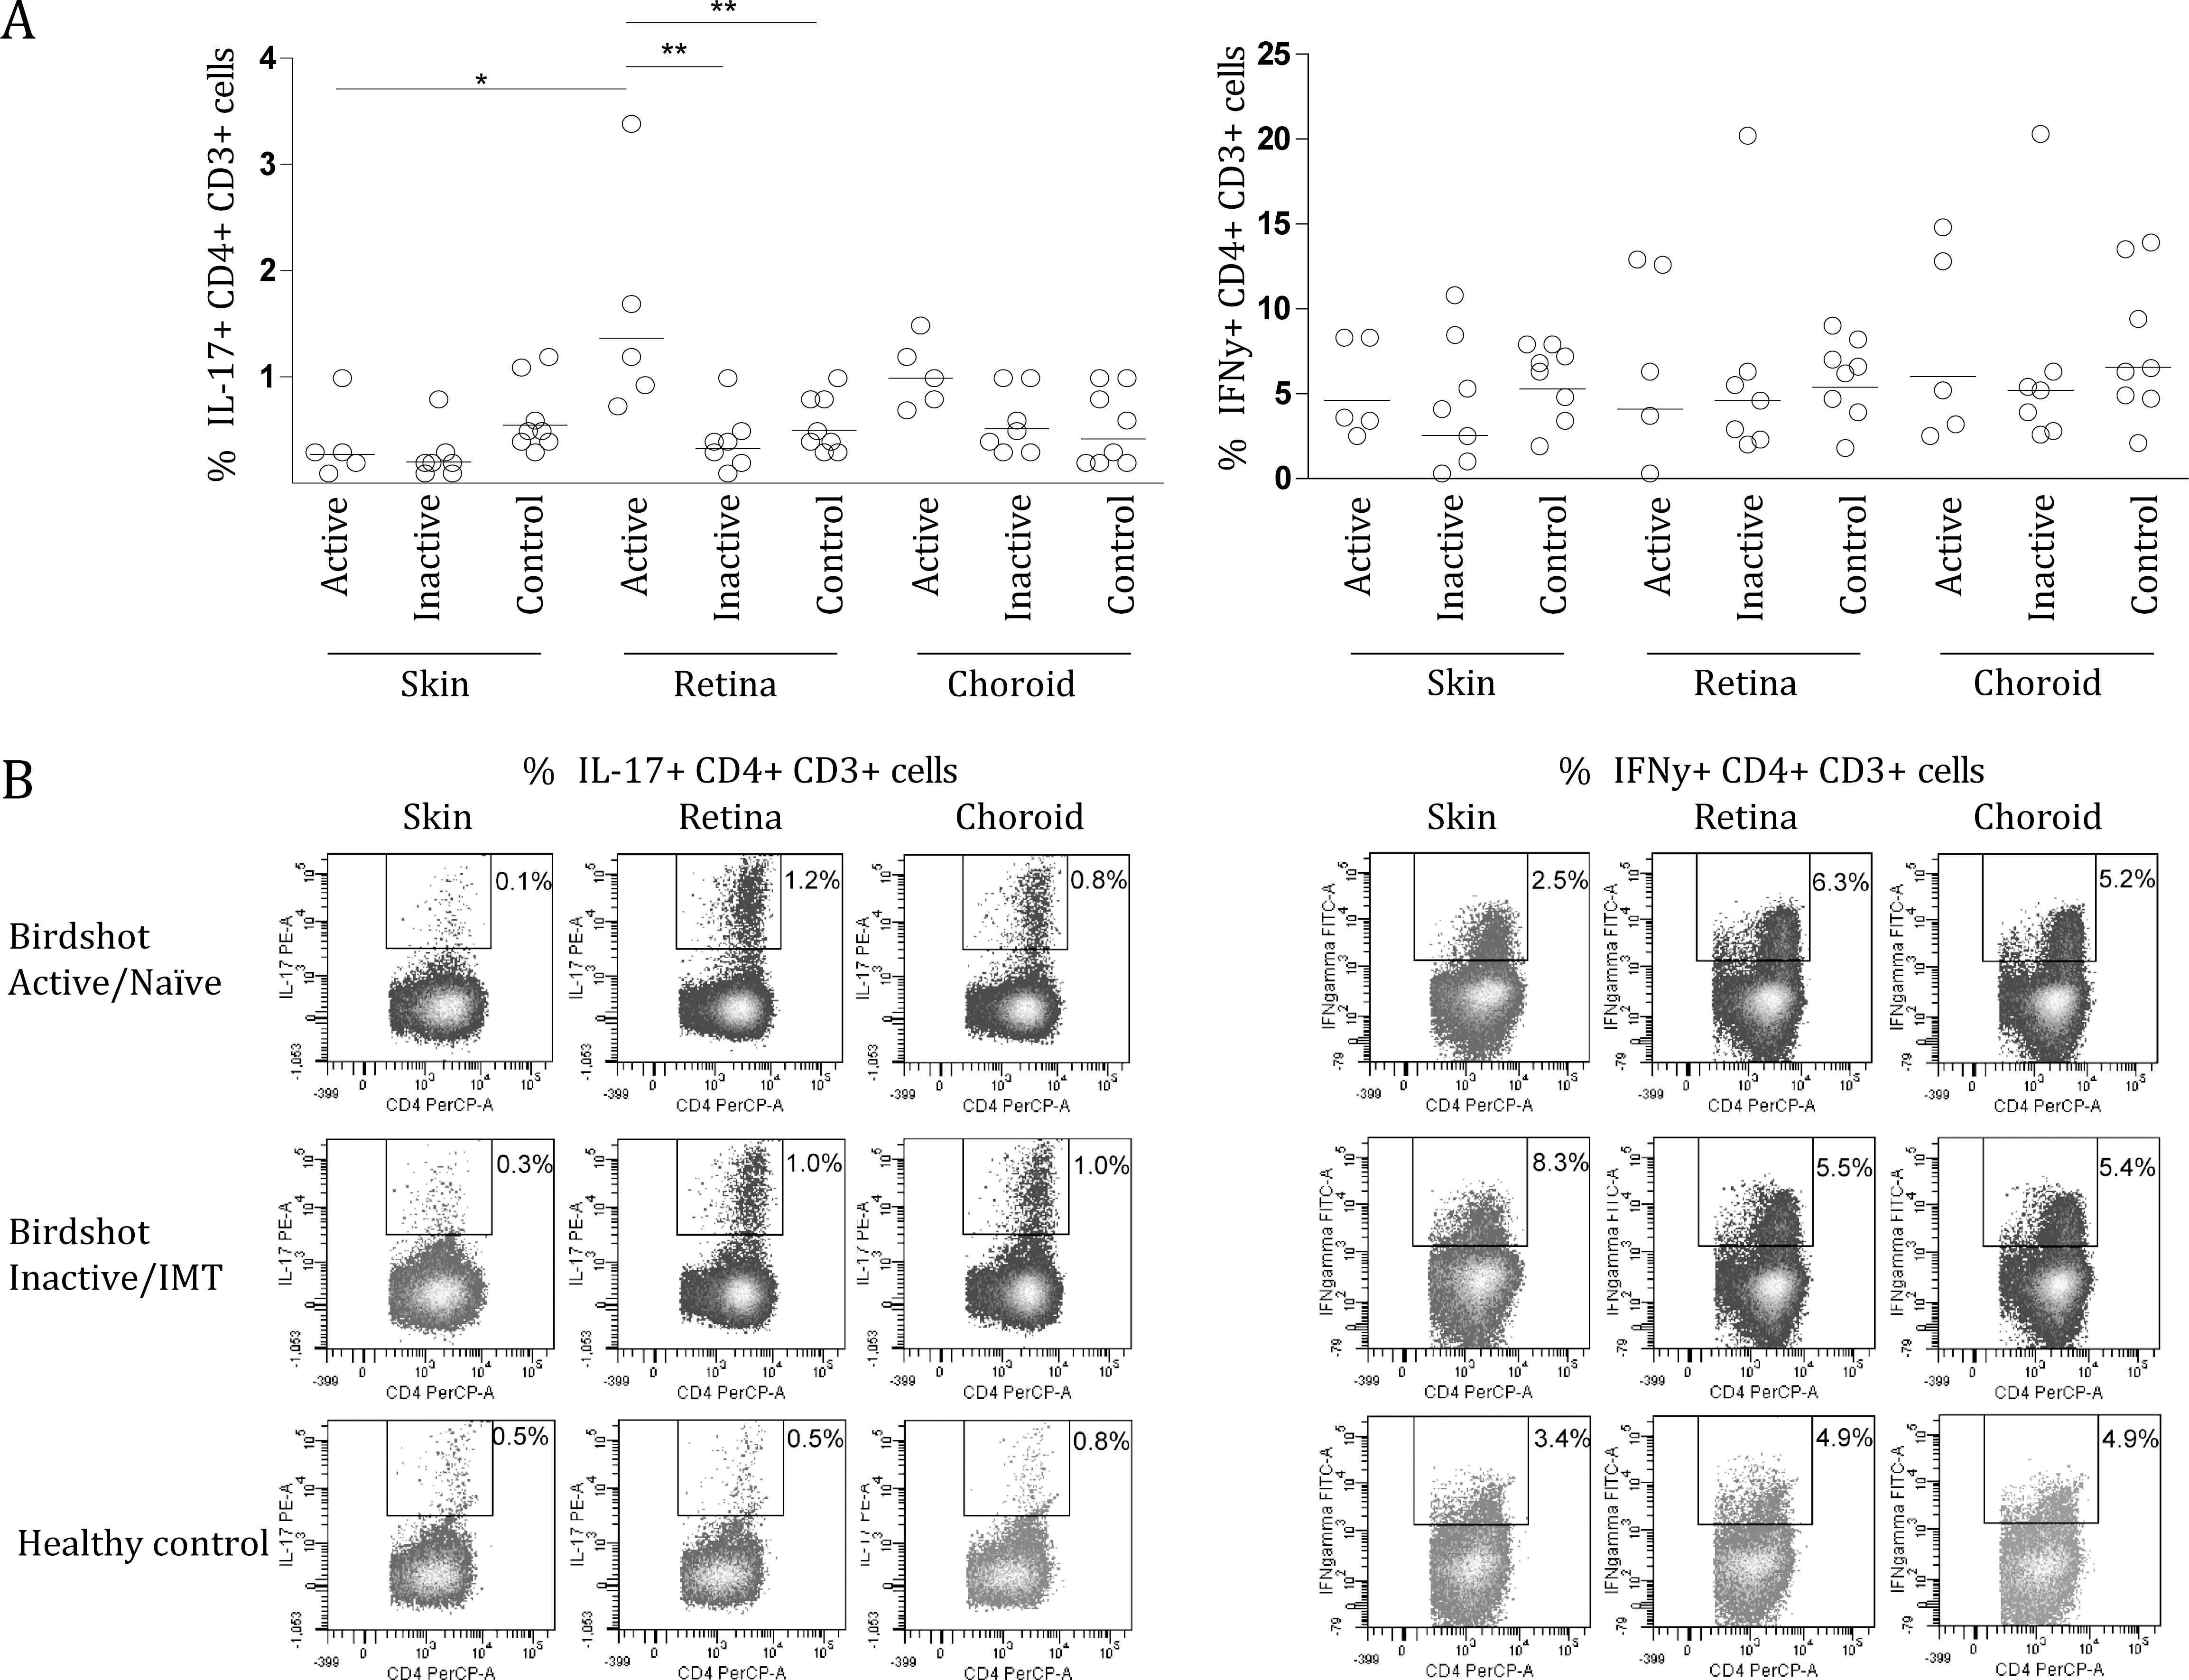
 Figure 2 of
Kuiper, Mol Vis 2013; 19:2606-2614.
Figure 2 of
Kuiper, Mol Vis 2013; 19:2606-2614.