Figure 3. Comparison of slit-lamp pictures to spectral domain optical coherence tomography (SD-OCT) images from representative animals
7 days after contact lens fitting. A: Slit-lamp examination of the control eye showed no signs of inflammation. D: The corresponding SD-OCT image of the control eye showed normal thickness of the cornea and clear tissue planes. White arrows
point to the epithelium, stroma, and endothelium. B: Slit-lamp pictures of the eyes fitted with Fusarium-soaked contact lenses revealed for the majority of rats severe keratitis with abscess formation. E: Corresponding SD-OCT images disclosed an abnormally thickened, hyper-reflective corneal tissue, most likely representing
the corneal abscess. Note the absence of the overlying epithelium, unidentifiable tissue planes, and the presence of endothelial
plaques (arrow). C: In a few cases the slit-lamp picture of the rat eye showed only subtle infiltrates (white arrow). F: In contrast, the SD-OCT image of the same eyes showed increased corneal thickening, several areas of hyper-reflectivity
representing infiltrates (yellow arrowheads), and endothelial plaques (white arrows). Stromal edema resulted in a change in
the convexity of the posterior corneal surface (white star). Scale bar=100 μm.
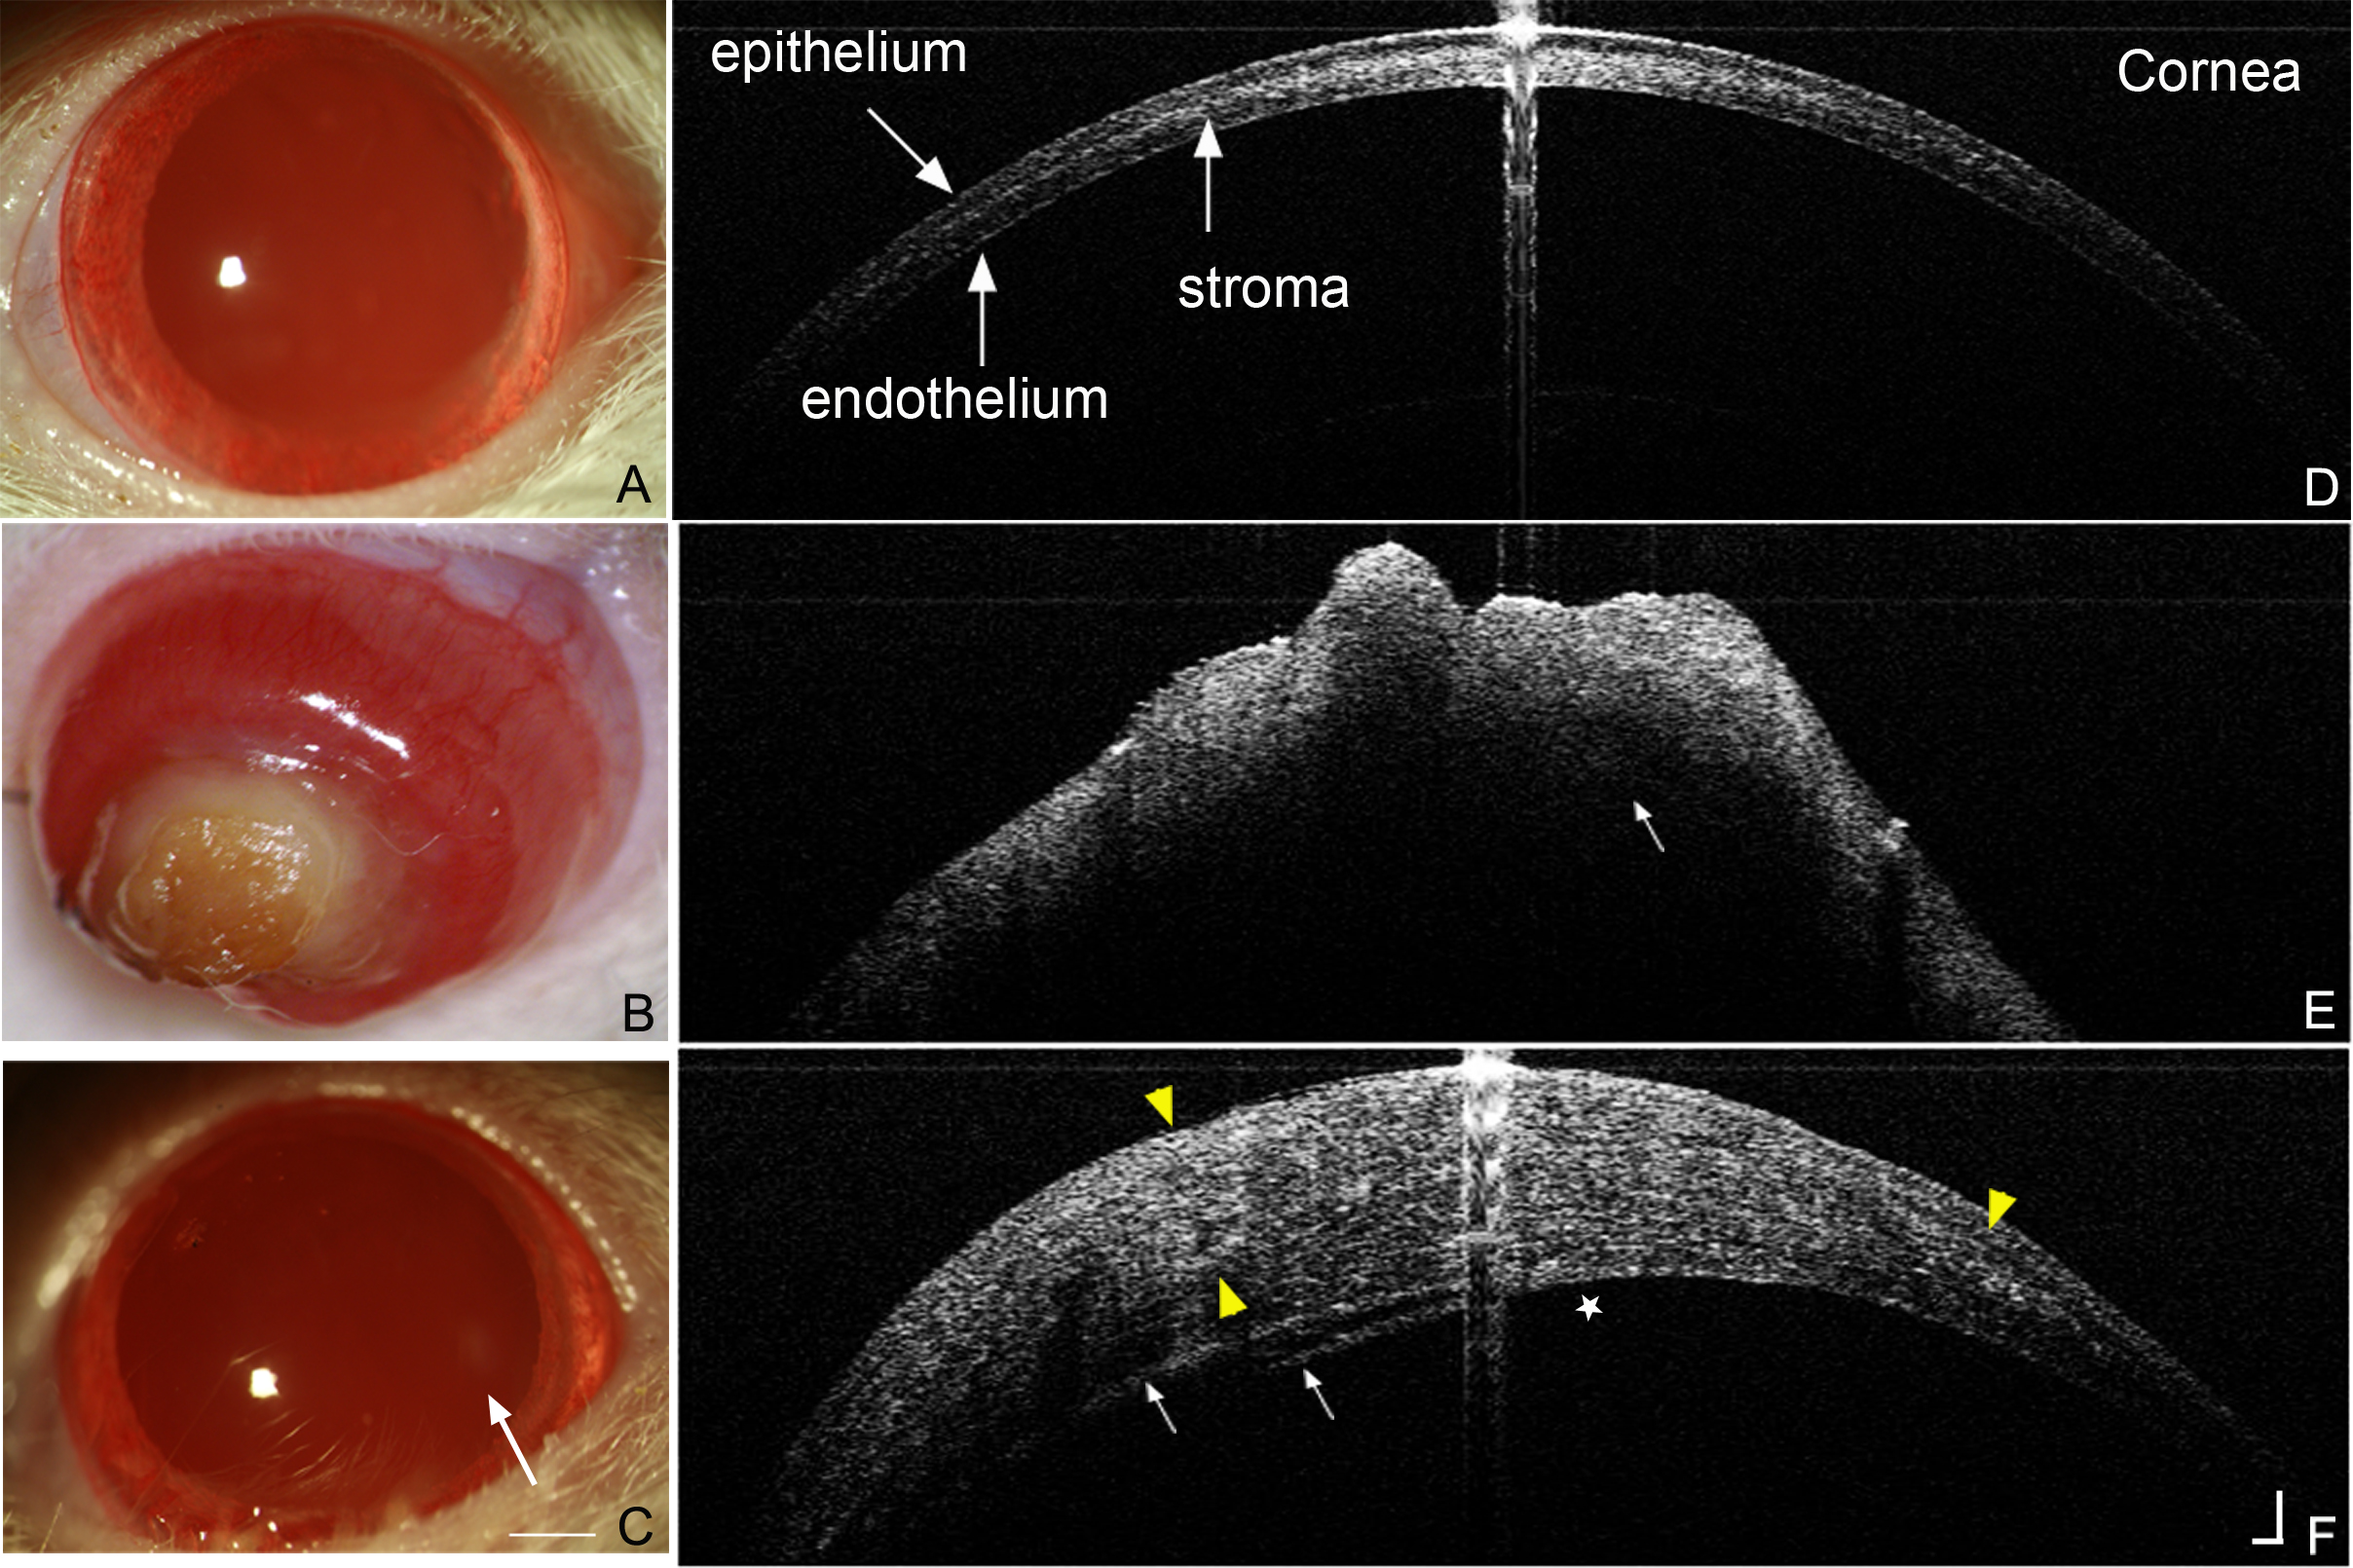
 Figure 3 of
Abou Shousha, Mol Vis 2013; 19:2596-2605.
Figure 3 of
Abou Shousha, Mol Vis 2013; 19:2596-2605.