Figure 9. Fluorescence intensities of contractile markers in the trabecular meshwork (TM) and ciliary muscle (CM) based on quantitative
analysis. Mean (±mean of standard error [SEM] error bars) fluorescence intensity (mean of grey pixel values in 8 region of
interest (ROI) within TM or CM; n=3 mice per label) is represented by columns. In the CM, MHC mean fluorescence intensity
was significantly less than that of F-actin (p=0.02). In the TM, mean fluorescence intensity was greatest for MHC and least
for calponin. TM mean fluorescence intensities of α-SMA, caldesmon and calponin were less than that of F-actin and MHC (p=0.0006).
Fluorescence intensities of F-actin and classic smooth muscle markers, caldesmon, α-SMA and calponin, were significantly higher
in the CM compared with the TM (p<0.0001). MHC fluorescence intensity in the TM and CM was similar (p>0.05).
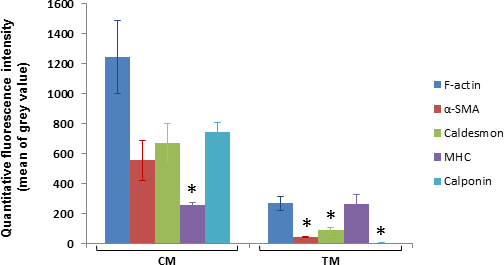
 Figure 9 of
Ko, Mol Vis 2013; 19:2561-2570.
Figure 9 of
Ko, Mol Vis 2013; 19:2561-2570.