Figure 4. Caldesmon and F-actin immunolocalization in the trabecular meshwork (TM) and ciliary muscle (CM). A: Positive caldesmon labeling was present in its posterior portion of the CM (opened arrows) with extension to the iridocorneal
angle (arrowhead). B: Positive F-actin labeling (red) was seen in in ciliary processes, CM and TM. C: F-actin and caldesmon co-localization was seen primarily in the CM (opened arrows, yellow), with co-localization more spotty
in the TM (closed arrows, red). D: Bright field for tissue orientation. E: Merged bright field and fluorescence images provide detailed structural orientation. F: Magnified image of dotted square of C showed that F-actin and caldesmon co-localization was seen primarily in the CM (yellow; opened arrows). In the TM next to
SC (dotted outline, asterisk *), caldesmon and F-actin co-localization was spotty (closed arrows). Scale bars, 20 μm.
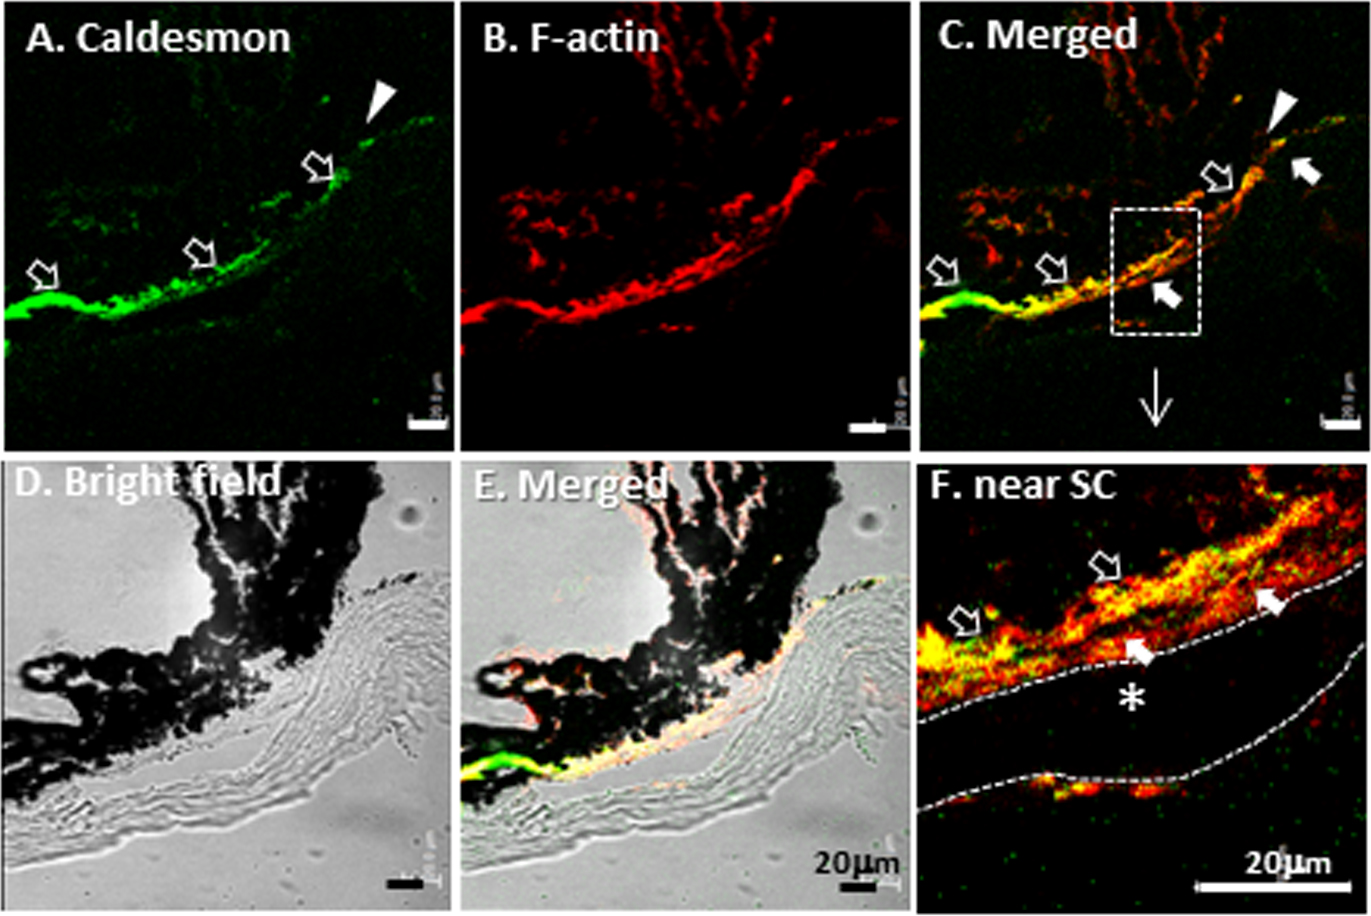
 Figure 4 of
Ko, Mol Vis 2013; 19:2561-2570.
Figure 4 of
Ko, Mol Vis 2013; 19:2561-2570.