Figure 3. α-Smooth muscle actin (SMA) and F-actin immunolocalization in the trabecular meshwork (TM) and ciliary muscle (CM). A: Positive α-SMA labeling was seen in posterior regions of the CM (opened arrows) and anteriorly near the iridocorneal angle
(arrowhead). B: Positive F-actin labeling (red) was seen in ciliary processes, CM and TM. C: Co-localization of F-actin and α-SMA labeling. α-SMA labeling was positive but of low intensity and patchy in cellular layers
of the TM (closed arrows). D: Bright field for tissue orientation. E: Merged bright field and fluorescence images provide detailed structural orientation. F: Magnified image of dotted square of C: F-actin and α-SMA co-localization was intense in the CM, but patchy and less apparent in TM cellular layers adjacent to
SC (dotted outline, asterisk*). Scale bars, 20 μm.
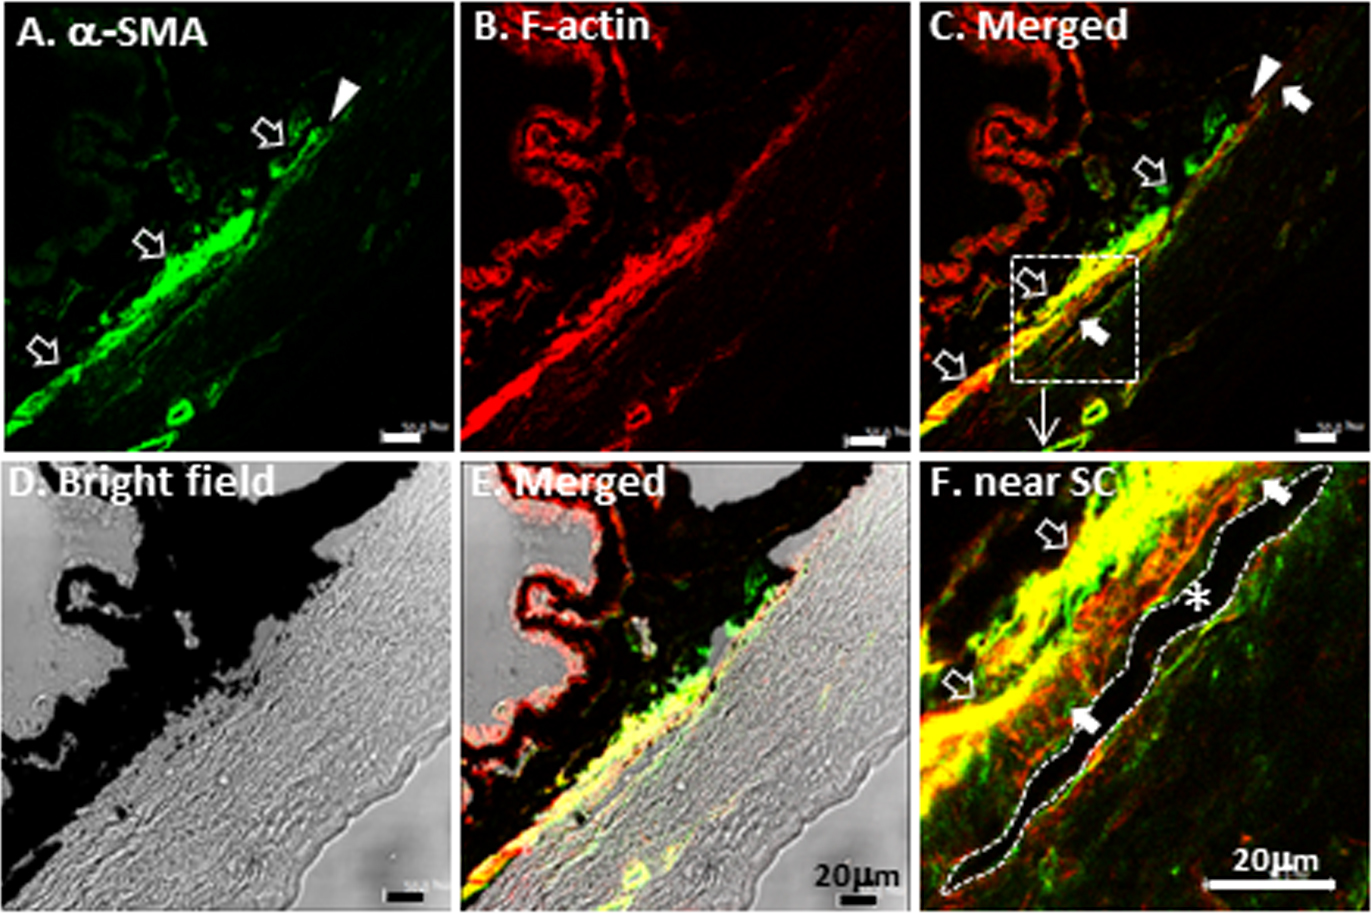
 Figure 3 of
Ko, Mol Vis 2013; 19:2561-2570.
Figure 3 of
Ko, Mol Vis 2013; 19:2561-2570.