Figure 5. Semiquantitative reverse transcription-polymerase chain reaction (RT-PCR) analysis of inducible nitric oxide synthase messenger
RNA (mRNA) in rat lenses visualized on an ethidium bromide-stained agarose gel alongside messenger ribonucleic acid of glyceraldehydes-3-phosphate
dehydrogenase. A: M=100 bp DNA ladder; N=Group I (control); S=Group II (selenite-challenged, cataract-untreated); T=Group III (selenite-challenged,
C. maritima extract-treated). B: The results depicted are normalized to levels of glyceraldehydes-3-phosphate dehydrogenase (GAPDH). Data are mean value
(experiments run in triplicate) of ratios of intensity for gene of interest divided by that for GAPDH. aGroup I versus Group II and III values (p<0.05); bGroup II versus Group III values (p<0.05).
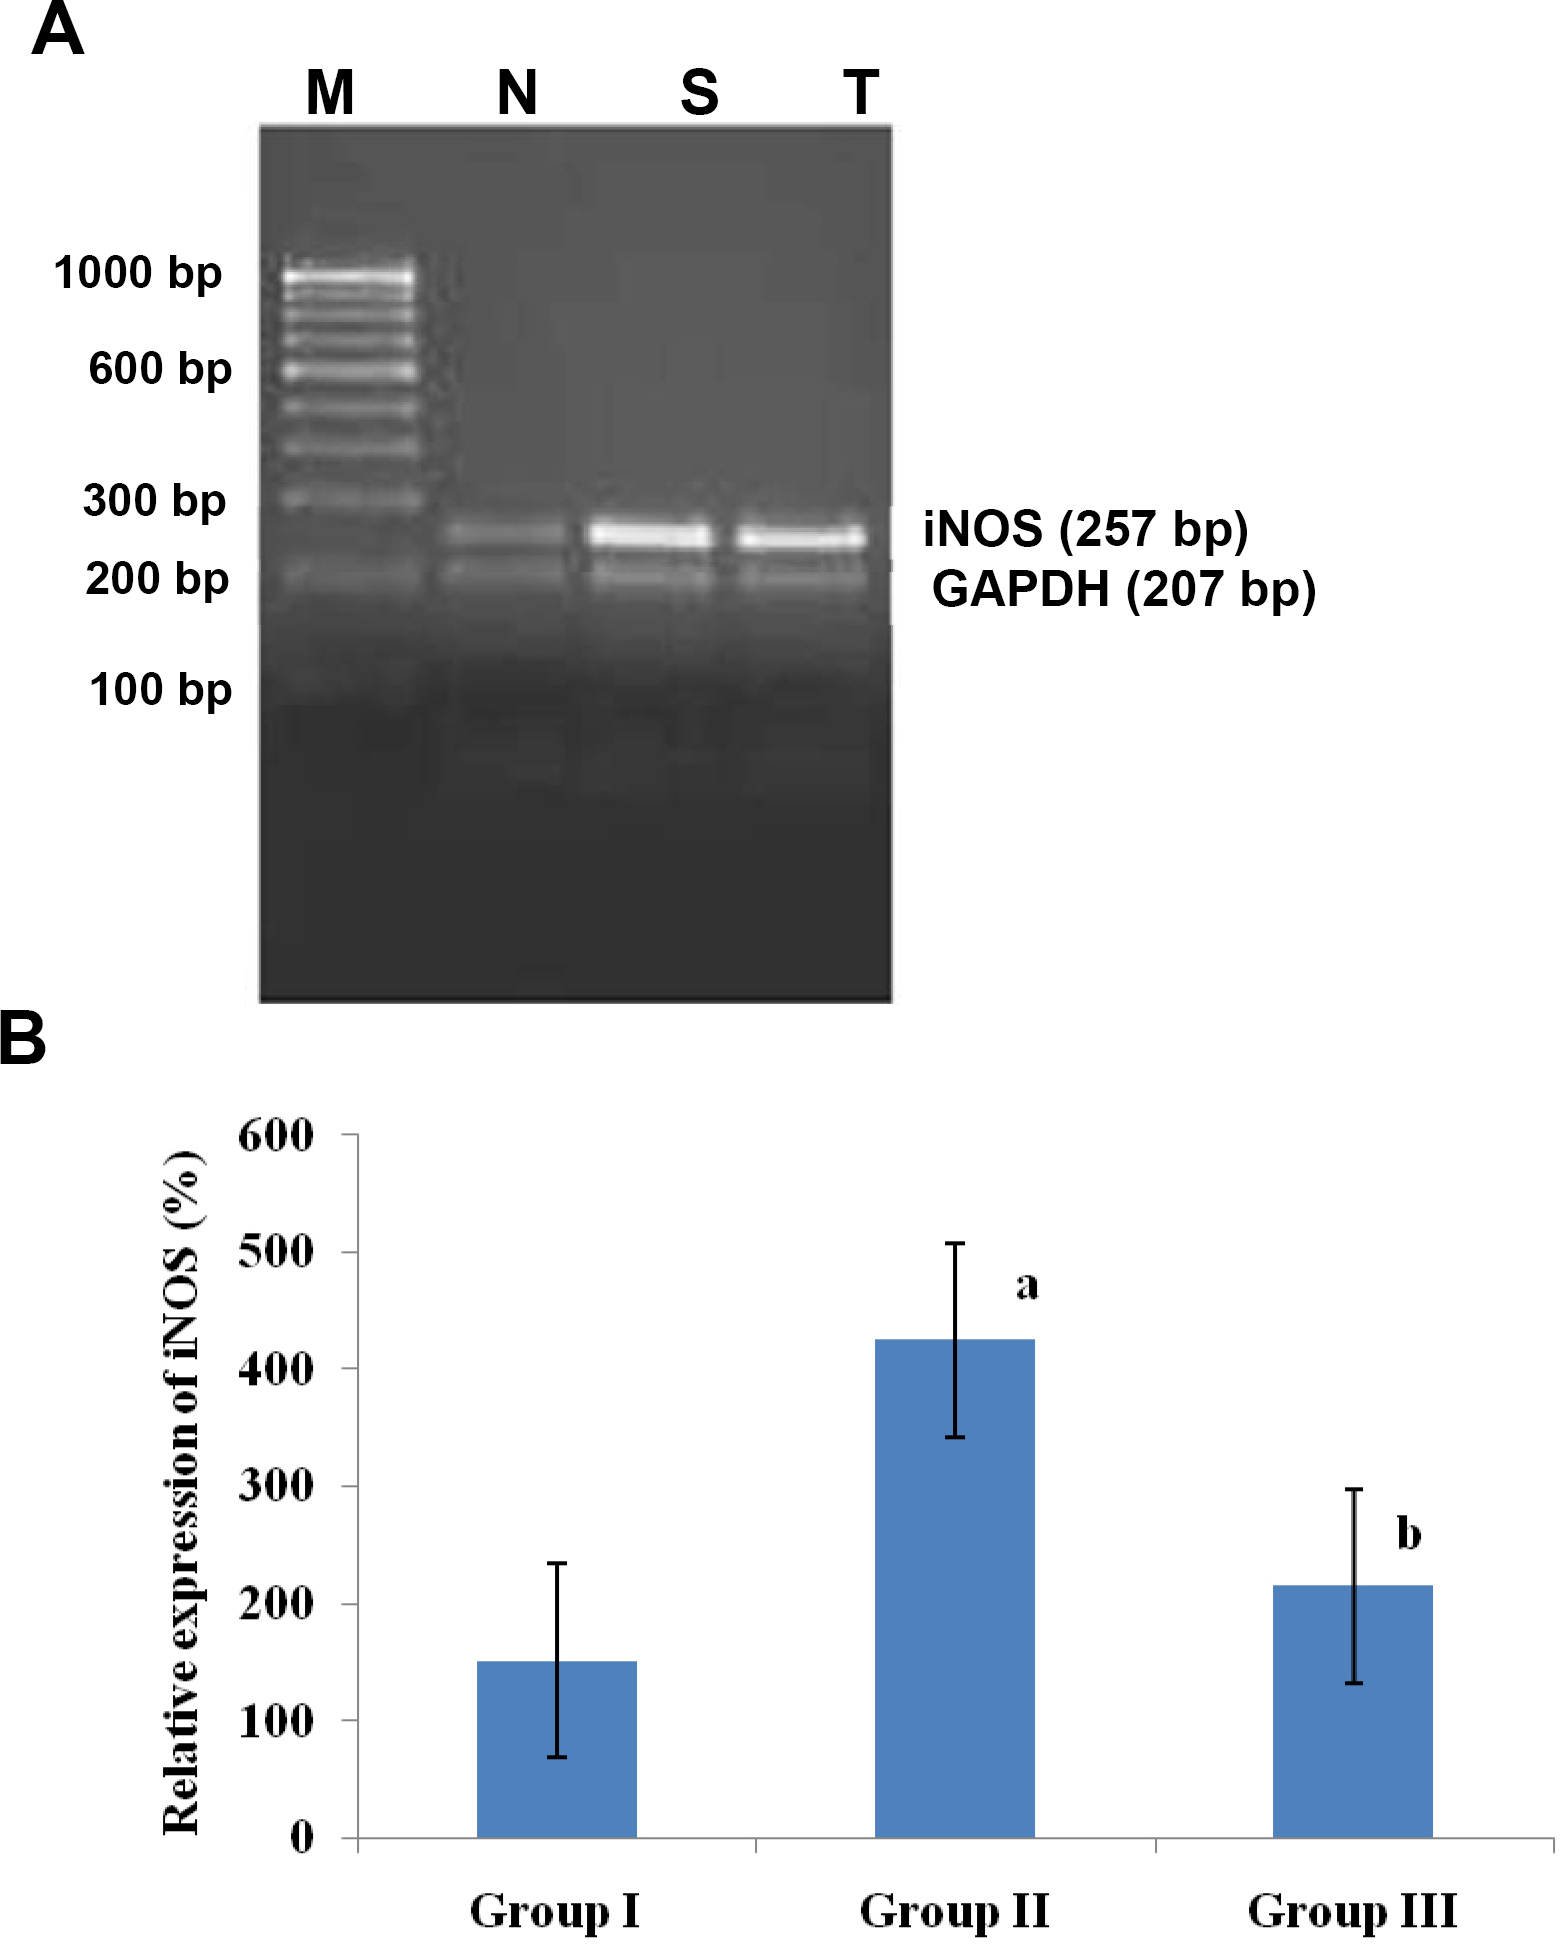
 Figure 5 of
Anitha, Mol Vis 2013; 19:2551-2560.
Figure 5 of
Anitha, Mol Vis 2013; 19:2551-2560.