Figure 9. Real-time polymerase chain reaction analysis of the proapoptotic gene BAD from the optic nerves and retinas of the glaucoma
model (A) and the NMDA retinal toxicity model (B). BAD gene expression increased significantly in both the optic nerves (ONs) and retinas of both models. The peak intraocular
pressure (IOP) was significantly correlated with BAD expression in the ONs and retinas (C,E: r=0.64, 0.87, p<0.05 respectively), as was the mean IOP (D,F: r=0.67, 0.85, p<0.05, respectively). Values are expressed as fold change of gene expression compared to a calibrator (endogenous
control, β-actin); n=5–7 rats at each time point. Data represent means±standard error of the mean (SEM); #significantly lower at p<0.05 than ON controls, **significantly lower at p<0.05 than retina controls.
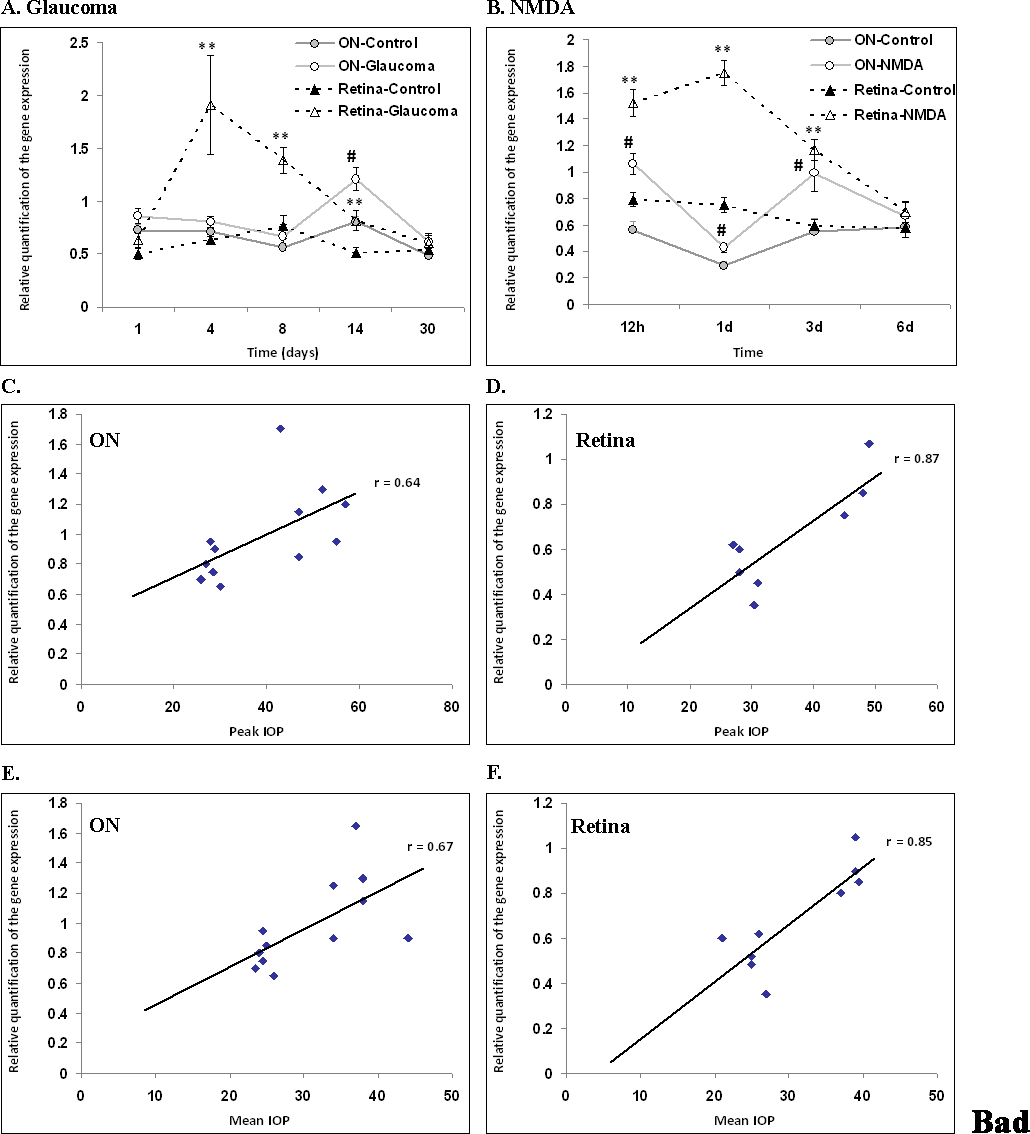
 Figure 9 of
Levkovitch-Verbin, Mol Vis 2013; 19:2526-2541.
Figure 9 of
Levkovitch-Verbin, Mol Vis 2013; 19:2526-2541.