Figure 10. Real-time polymerase chain reaction analysis of the proapoptotic gene, GADD45α, from the optic nerves and retinas in three
ocular models: (A) Glaucoma (B) ONTX, and (C) NMDA retinal toxicity. The GADD45α expression increased significantly in the optic nerves (ONs) and retinas of all 3 models.
The peak intraocular pressure (IOP) was significantly correlated with GADD45α expression in both the ONs and retinas (D,E: r=0.78, 0.76, p<0.05, respectively), as was the mean IOP (F,G: r=0.77, 0.85, p<0.05, respectively). Values are expressed as fold change of gene expression compared to a calibrator (endogenous
control, β-actin); n=5–7 rats at each time point. Data represent means±standard error of the mean (SEM); #significantly higher at p<0.05 than ON controls, **significantly higher at p<0.05 than retina controls.
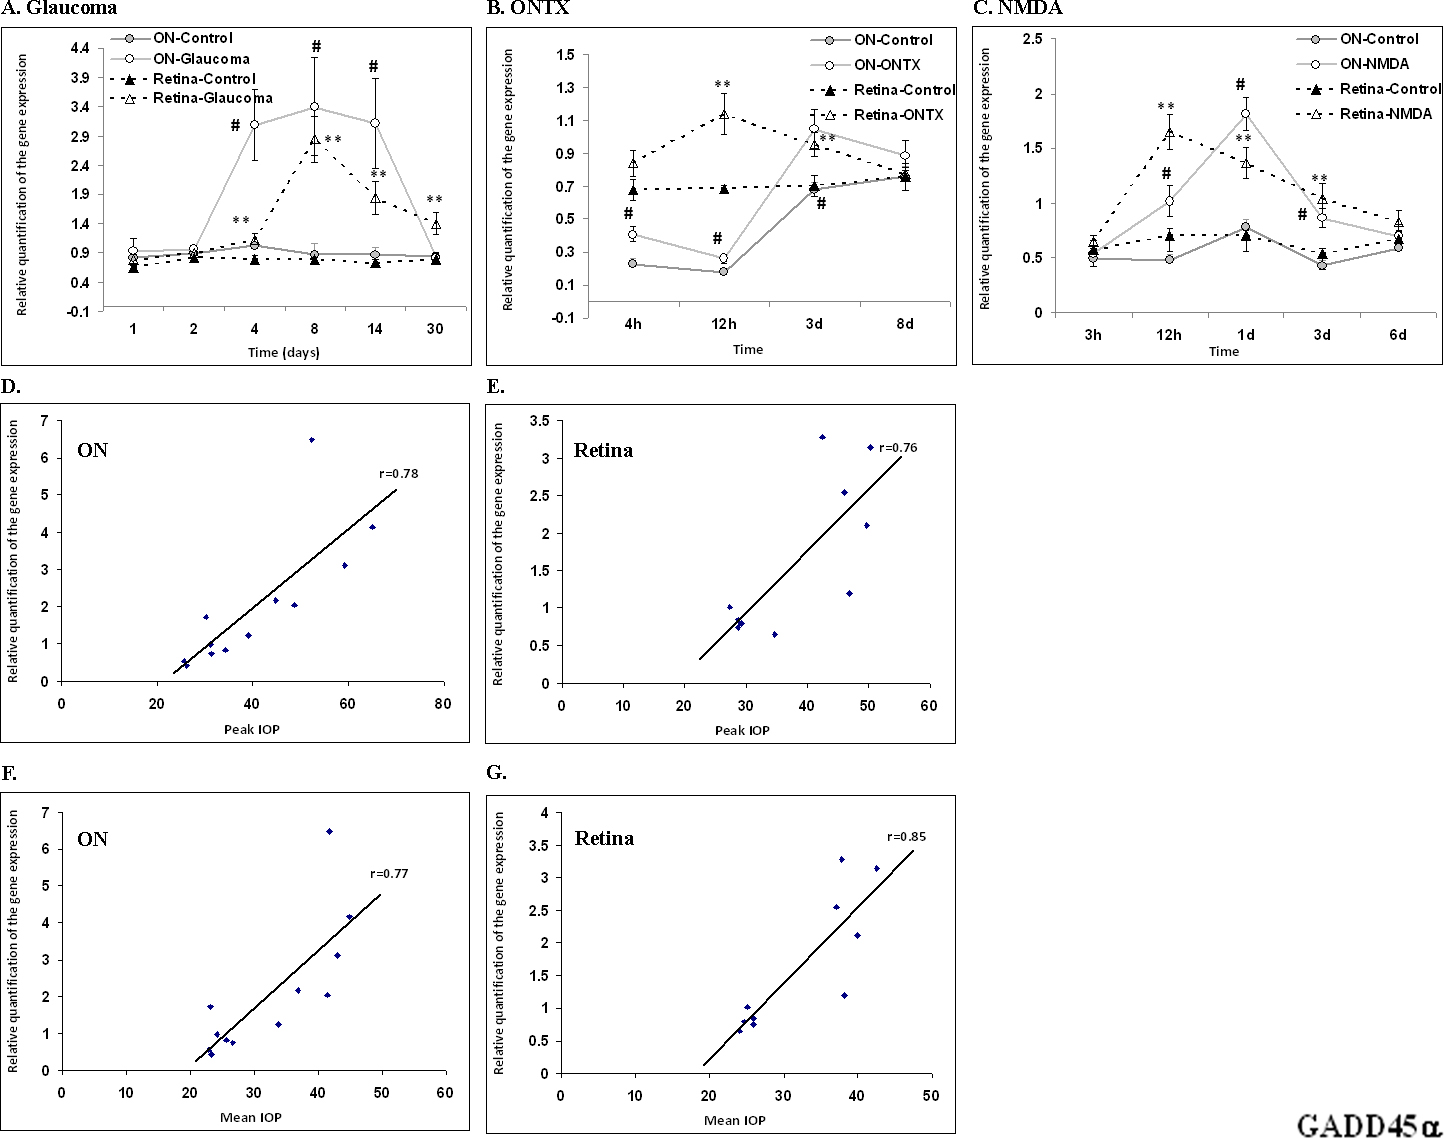
 Figure 10 of
Levkovitch-Verbin, Mol Vis 2013; 19:2526-2541.
Figure 10 of
Levkovitch-Verbin, Mol Vis 2013; 19:2526-2541.