Figure 1. D6 chemokine receptor expression by dendritic cells promotes their maturation. A: Flow cytometry analysis of whole spleen cells for D6 expression on CD4+ and CD8+ T cells, Gr-1high neutrophils, CD11b+ macrophages, and CD11c+ dendritic cells (DCs). The black line represents D6, the gray area represents the isotype control. D6 expression was higher
in DCs compared to other leukocyte populations. B: Flow cytometry analysis of bone marrow–derived DCs for major histocompatibility complex (MHC) II and co-stimulatory molecules,
CD40, CD80, and CD86 (black area) versus the isotype control (gray area) is shown. Bone marrow–derived DCs from D6−/− and wild-type (WT; D6+/+) mice were analyzed 24 h after lipopolysaccharides (LPS; 100 ng/ml) treatment.
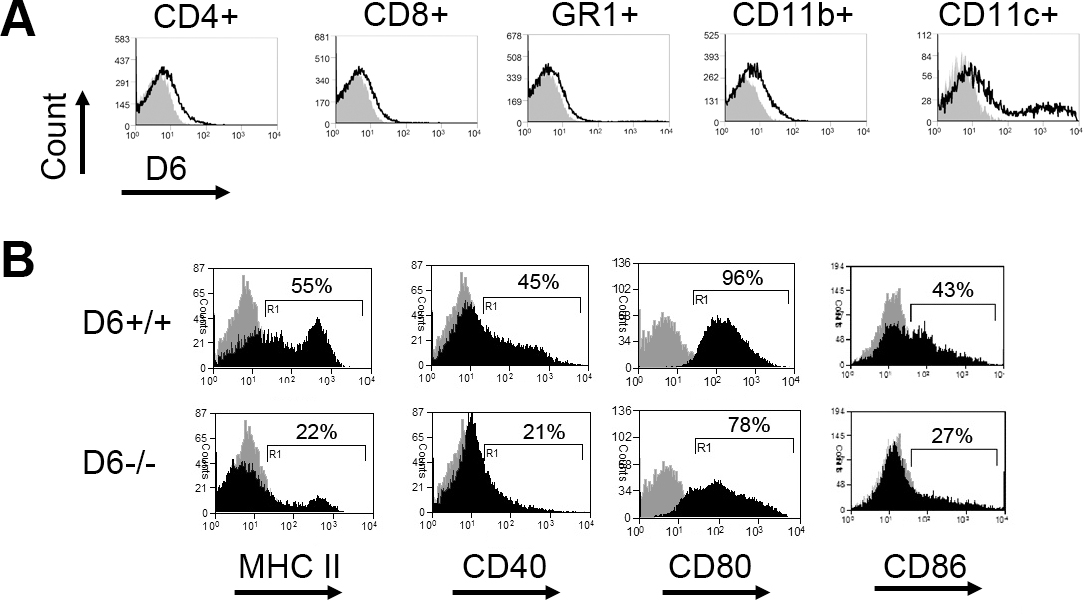
 Figure 1 of
Hajrasouliha, Mol Vis 2013; 19:2517-2525.
Figure 1 of
Hajrasouliha, Mol Vis 2013; 19:2517-2525.