Figure 4. The comparative mRNA expression of target genes in ten keratoconus (KCN) and pooled normal corneal tissues. This graph indicates
the comparison of transcript band intensities for genes encoding superoxide dismutase 1 (SOD1), transforming growth factor, beta 1 (TGF-β1), and dual-specificity phosphatase 1 (DUSP1) between the KCN and non-KCN samples. The values were calculated relative to the beta 2 microglobulin (B2M) levels (as normalizer) and reported as mean percentages. Note that the KCN corneas showed a three- and fivefold increase
in TGF-B1 and DUSP1 when compared to the pooled normal corneas. The RNA levels for SOD1 were similar for the KCN and normal corneas (p<0.05). Normal corneal samples were pooled to reduce tissue preparation errors.
The error bars represent the standard deviation.
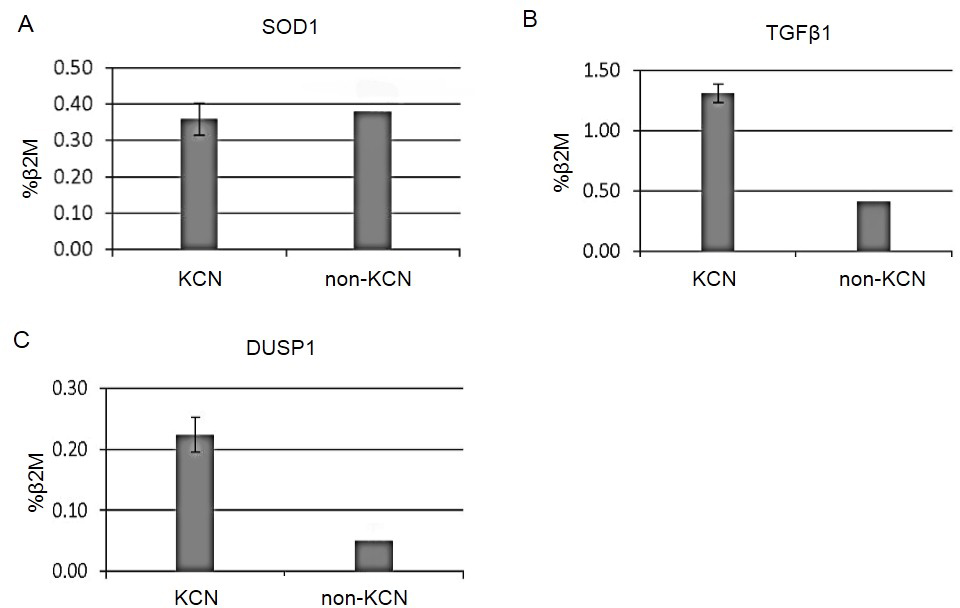
 Figure 4 of
Saee-Rad, Mol Vis 2013; 19:2501-2507.
Figure 4 of
Saee-Rad, Mol Vis 2013; 19:2501-2507.