Figure 2. Clinical features in UTAD701–01, right eye. A: Color fundus photograph shows retinal vascular attenuation and mild disc pallor; thin white lines outline the retinal region
imaged using adaptive optics scanning laser ophthalmoscopy (AOSLO); the thick horizontal white line indicates the spectral
domain optical coherence tomography (SD-OCT) location. B: Goldmann visual field testing shows constriction to the I4e target (blue lines). C: Horizontal SD-OCT through the anatomic fovea shows cystoid macular edema near the fovea; the inner segment ellipsoid zone
band extends about 5 degrees from the fovea with loss of outer retinal layers at greater eccentricities. D: High-resolution foveal images acquired using adaptive optics scanning laser ophthalmoscopy (AOSLO) reveal walls of cystoid
spaces (dark lines). Cones are visible within the cystoid spaces. E: Cone spacing increased by 3.5–7.9 standard deviations above the normal mean (white numbers: standard deviations from normal
mean, small white spots and the red circle indicate fixation locus). Scale bars=1°.
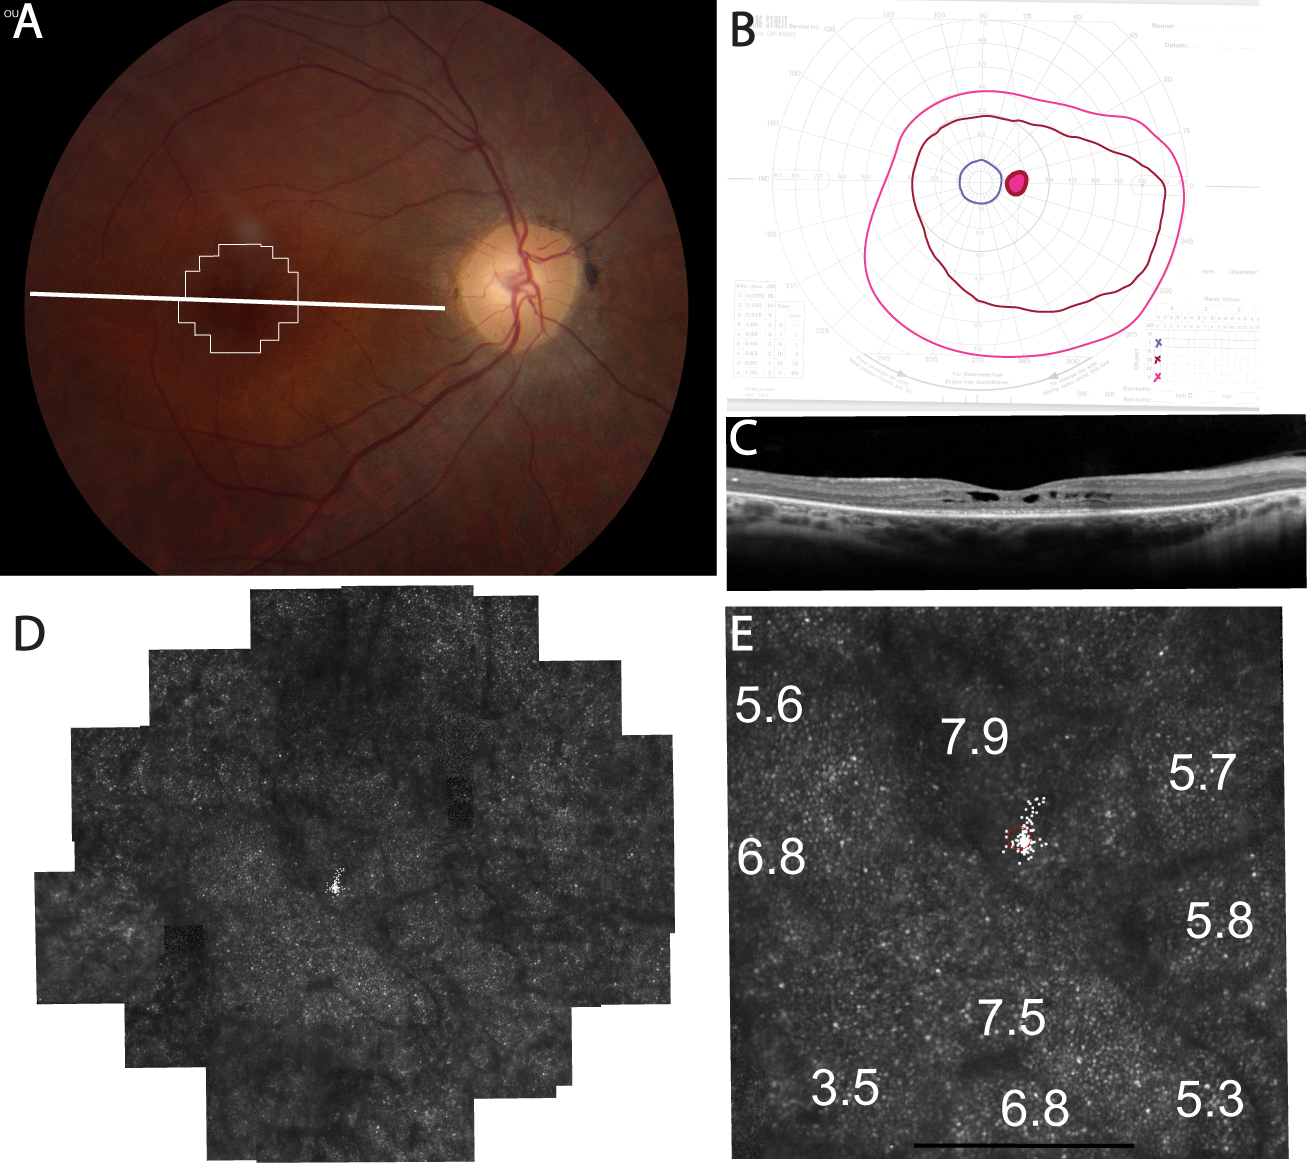
 Figure 2 of
Bowne, Mol Vis 2013; 19:2407-2417.
Figure 2 of
Bowne, Mol Vis 2013; 19:2407-2417.