Figure 4. Evaluating the apoptosis or activation of caspase-3 activity at hypoxic condition (H200) and cotreatment of hypoxia with resveratrol
at 4 µg/ml (H200+4R) and 12 µg/ml (H200+12R). X-axis represents the treatment conditions. Y-axis represents the cleaved caspase-3
in percent after the adjustment of caspase-3 with cell number. C represents control or untreated cells. H represents hypoxic
condition. R represents resveratrol treatment. Data analysis: ANOVA with post hoc Tukey test. Asterisks indicate significant
difference compared with corresponding hypoxic cells (*p<0.05; n=3; error bars±standard error of mean [SEM]).
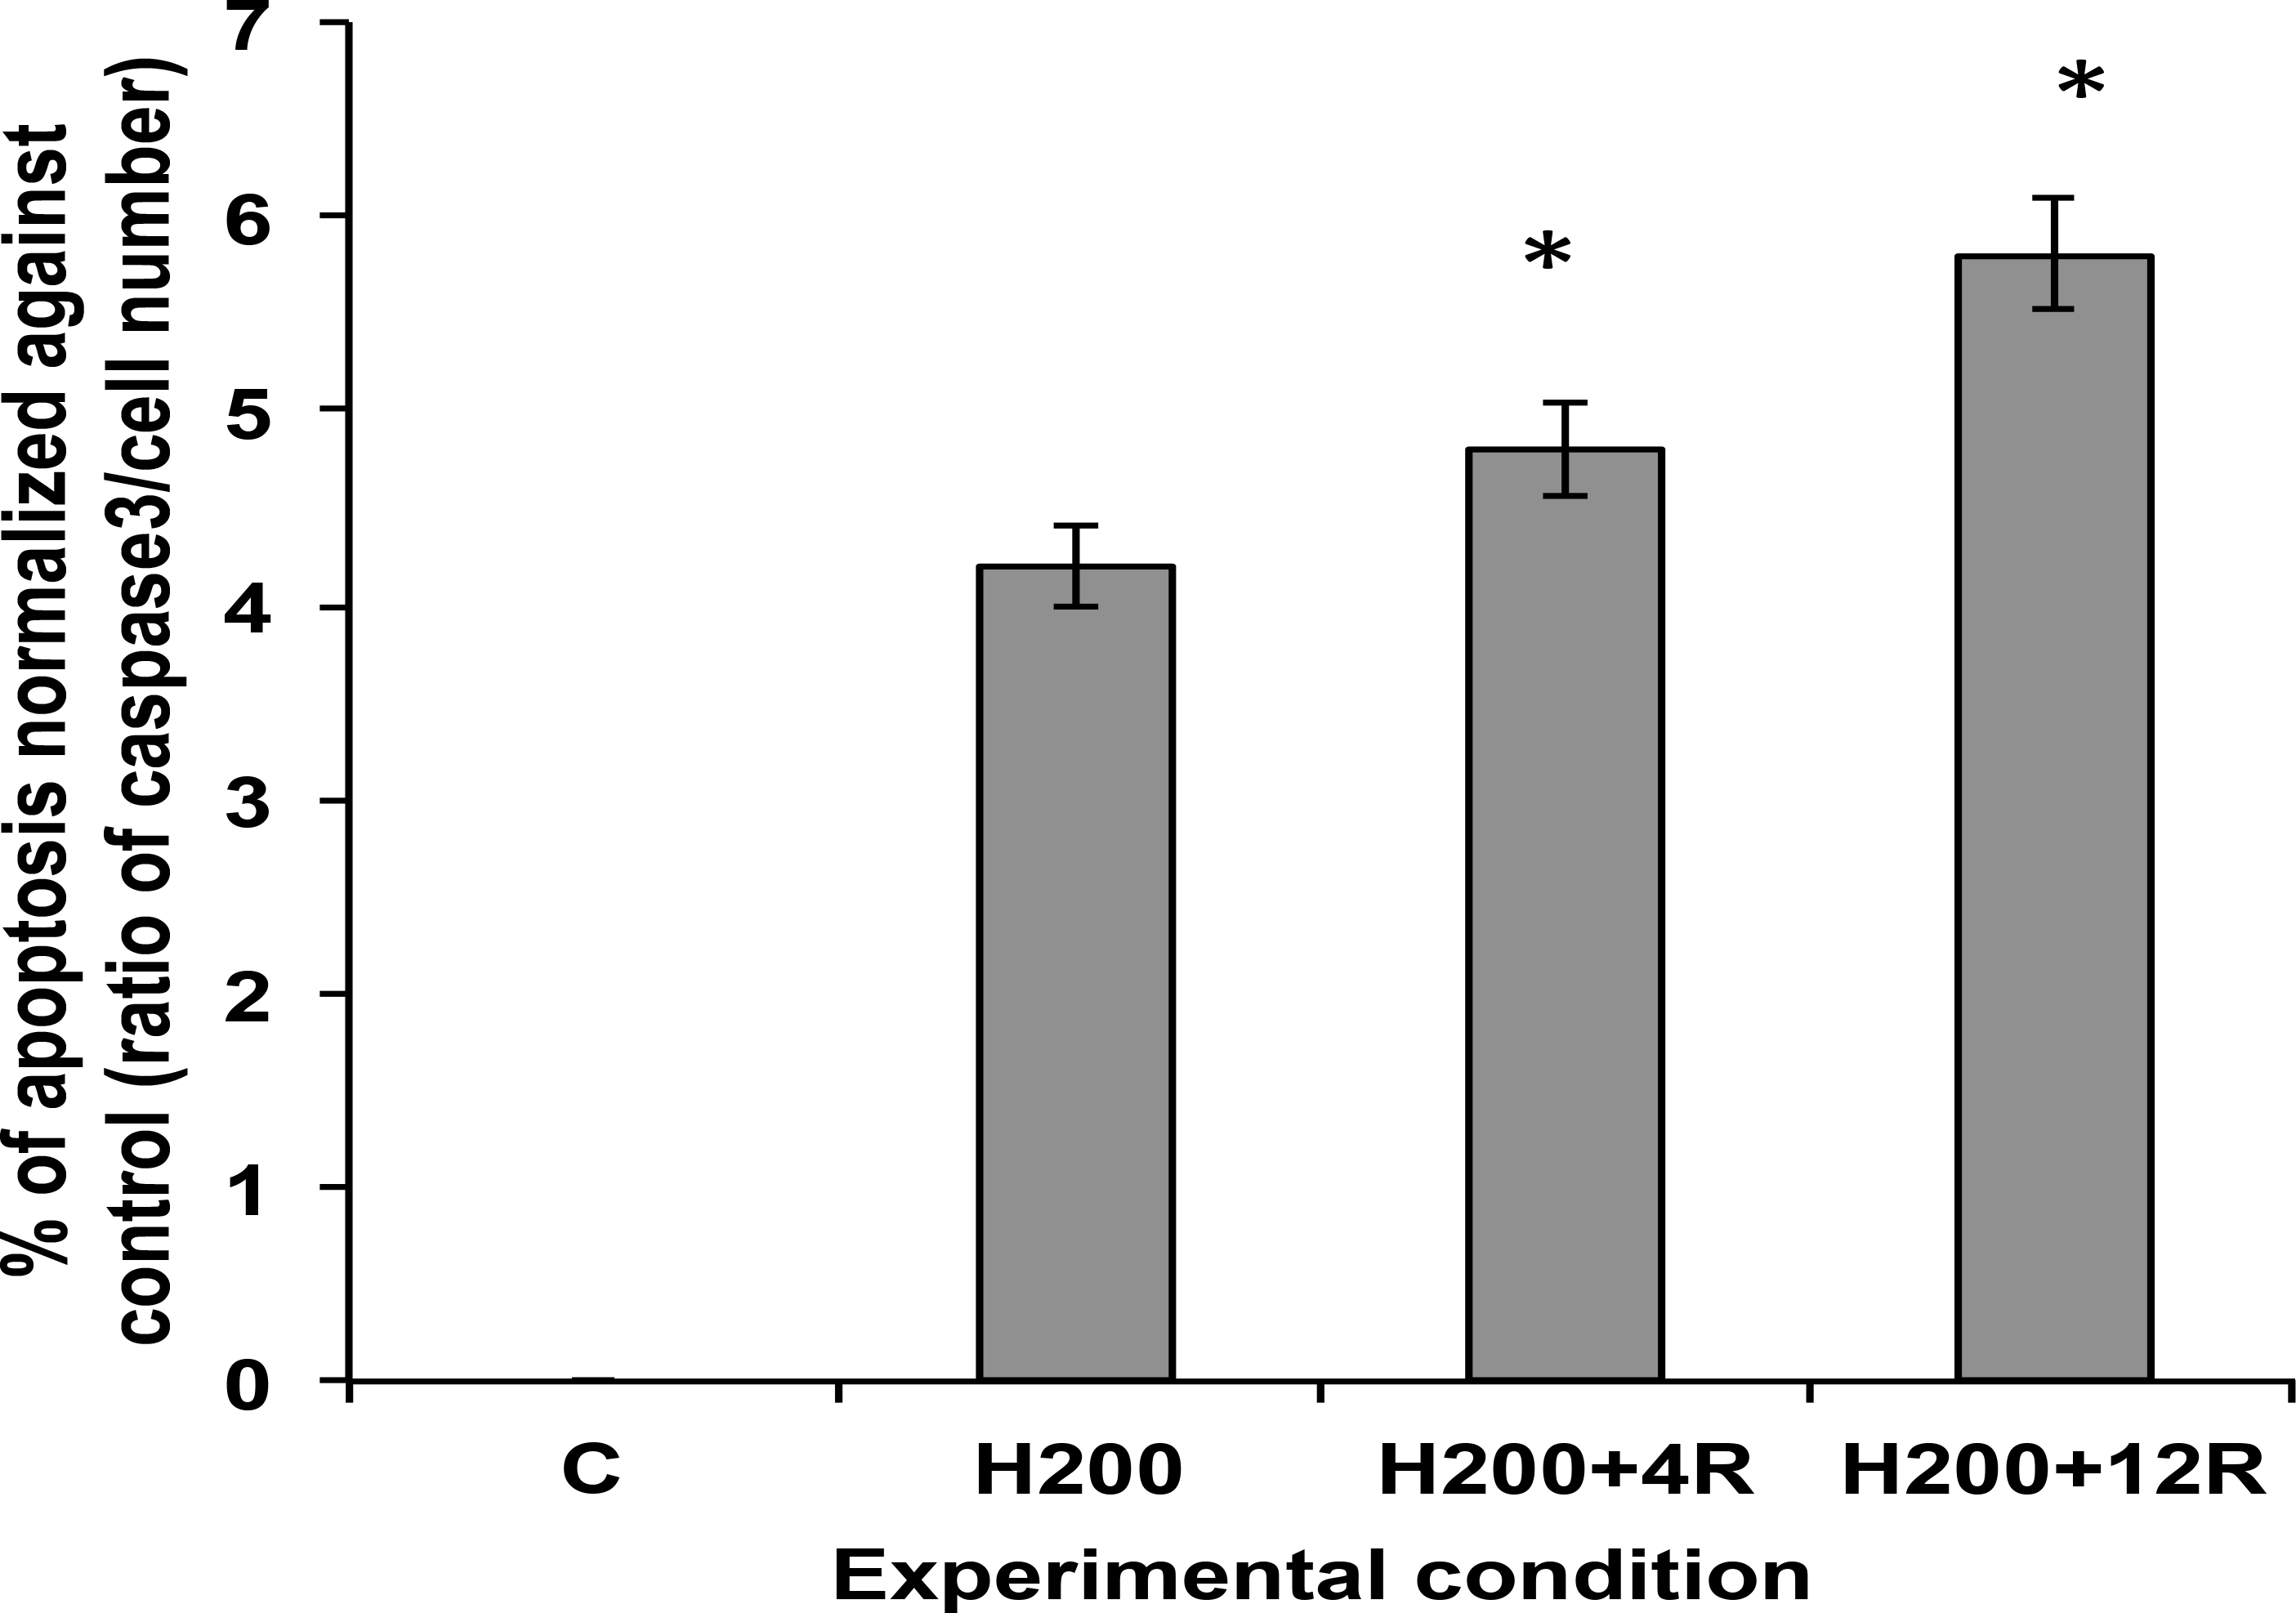
 Figure 4 of
Balaiya, Mol Vis 2013; 19:2385-2392.
Figure 4 of
Balaiya, Mol Vis 2013; 19:2385-2392.