Figure 3. Effect of resveratrol on activation of stress-activated protein kinase/c-Jun N-terminal kinase in hypoxic choroidal vascular
endothelial cells. A: Cells were treated with hypoxia mimetic cobalt chloride at 200 µM concentration (CoCl2; H200) for 24 h and cotreated with resveratrol at 4 µg/ml (H200+4R) and 12 µg/ml (H200+12R) to evaluate the activated/phosphorylated
stress-activated protein kinase/c-Jun N-terminal kinase (SAPK/JNK; top panel) and total SAPK/JNK (middle panel). The bottom
panel shows the glyceraldehyde-3-phosphate dehydrogenase (GAPDH) control. Representative data were shown. B: Bars represent optical density units of quantified activated/phosphorylated SAPK/JNK levels in percent. H represents hypoxia
mimetic cobalt chloride treatment. R represents resveratrol treatment. Asterisks indicate significant difference compared
with corresponding hypoxic cells (*p<0.01). Data were analyzed by ANOVA with post hoc Tukey test and represented as error
bars±standard error of mean (SEM; n=2). C: Choroidal vascular endothelial cells treated without/with hypoxia mimetic cobalt chloride at 200 µM concentration (CoCl2; H200) for 24 h and cotreated with resveratrol at 4 µg/ml (H200+4R) and 12 µg/ml (H200+12R). Representative data were shown.
D: Bars represent optical density units of quantified Sirt1 protein in percent. H represents hypoxia mimetic cobalt chloride
treatment. R represents resveratrol treatment. Asterisks indicate significant difference compared with corresponding hypoxic
cells (*p<0.01). Data were analyzed by ANOVA with post hoc Tukey test and represented as error bars±SEM (n=2).
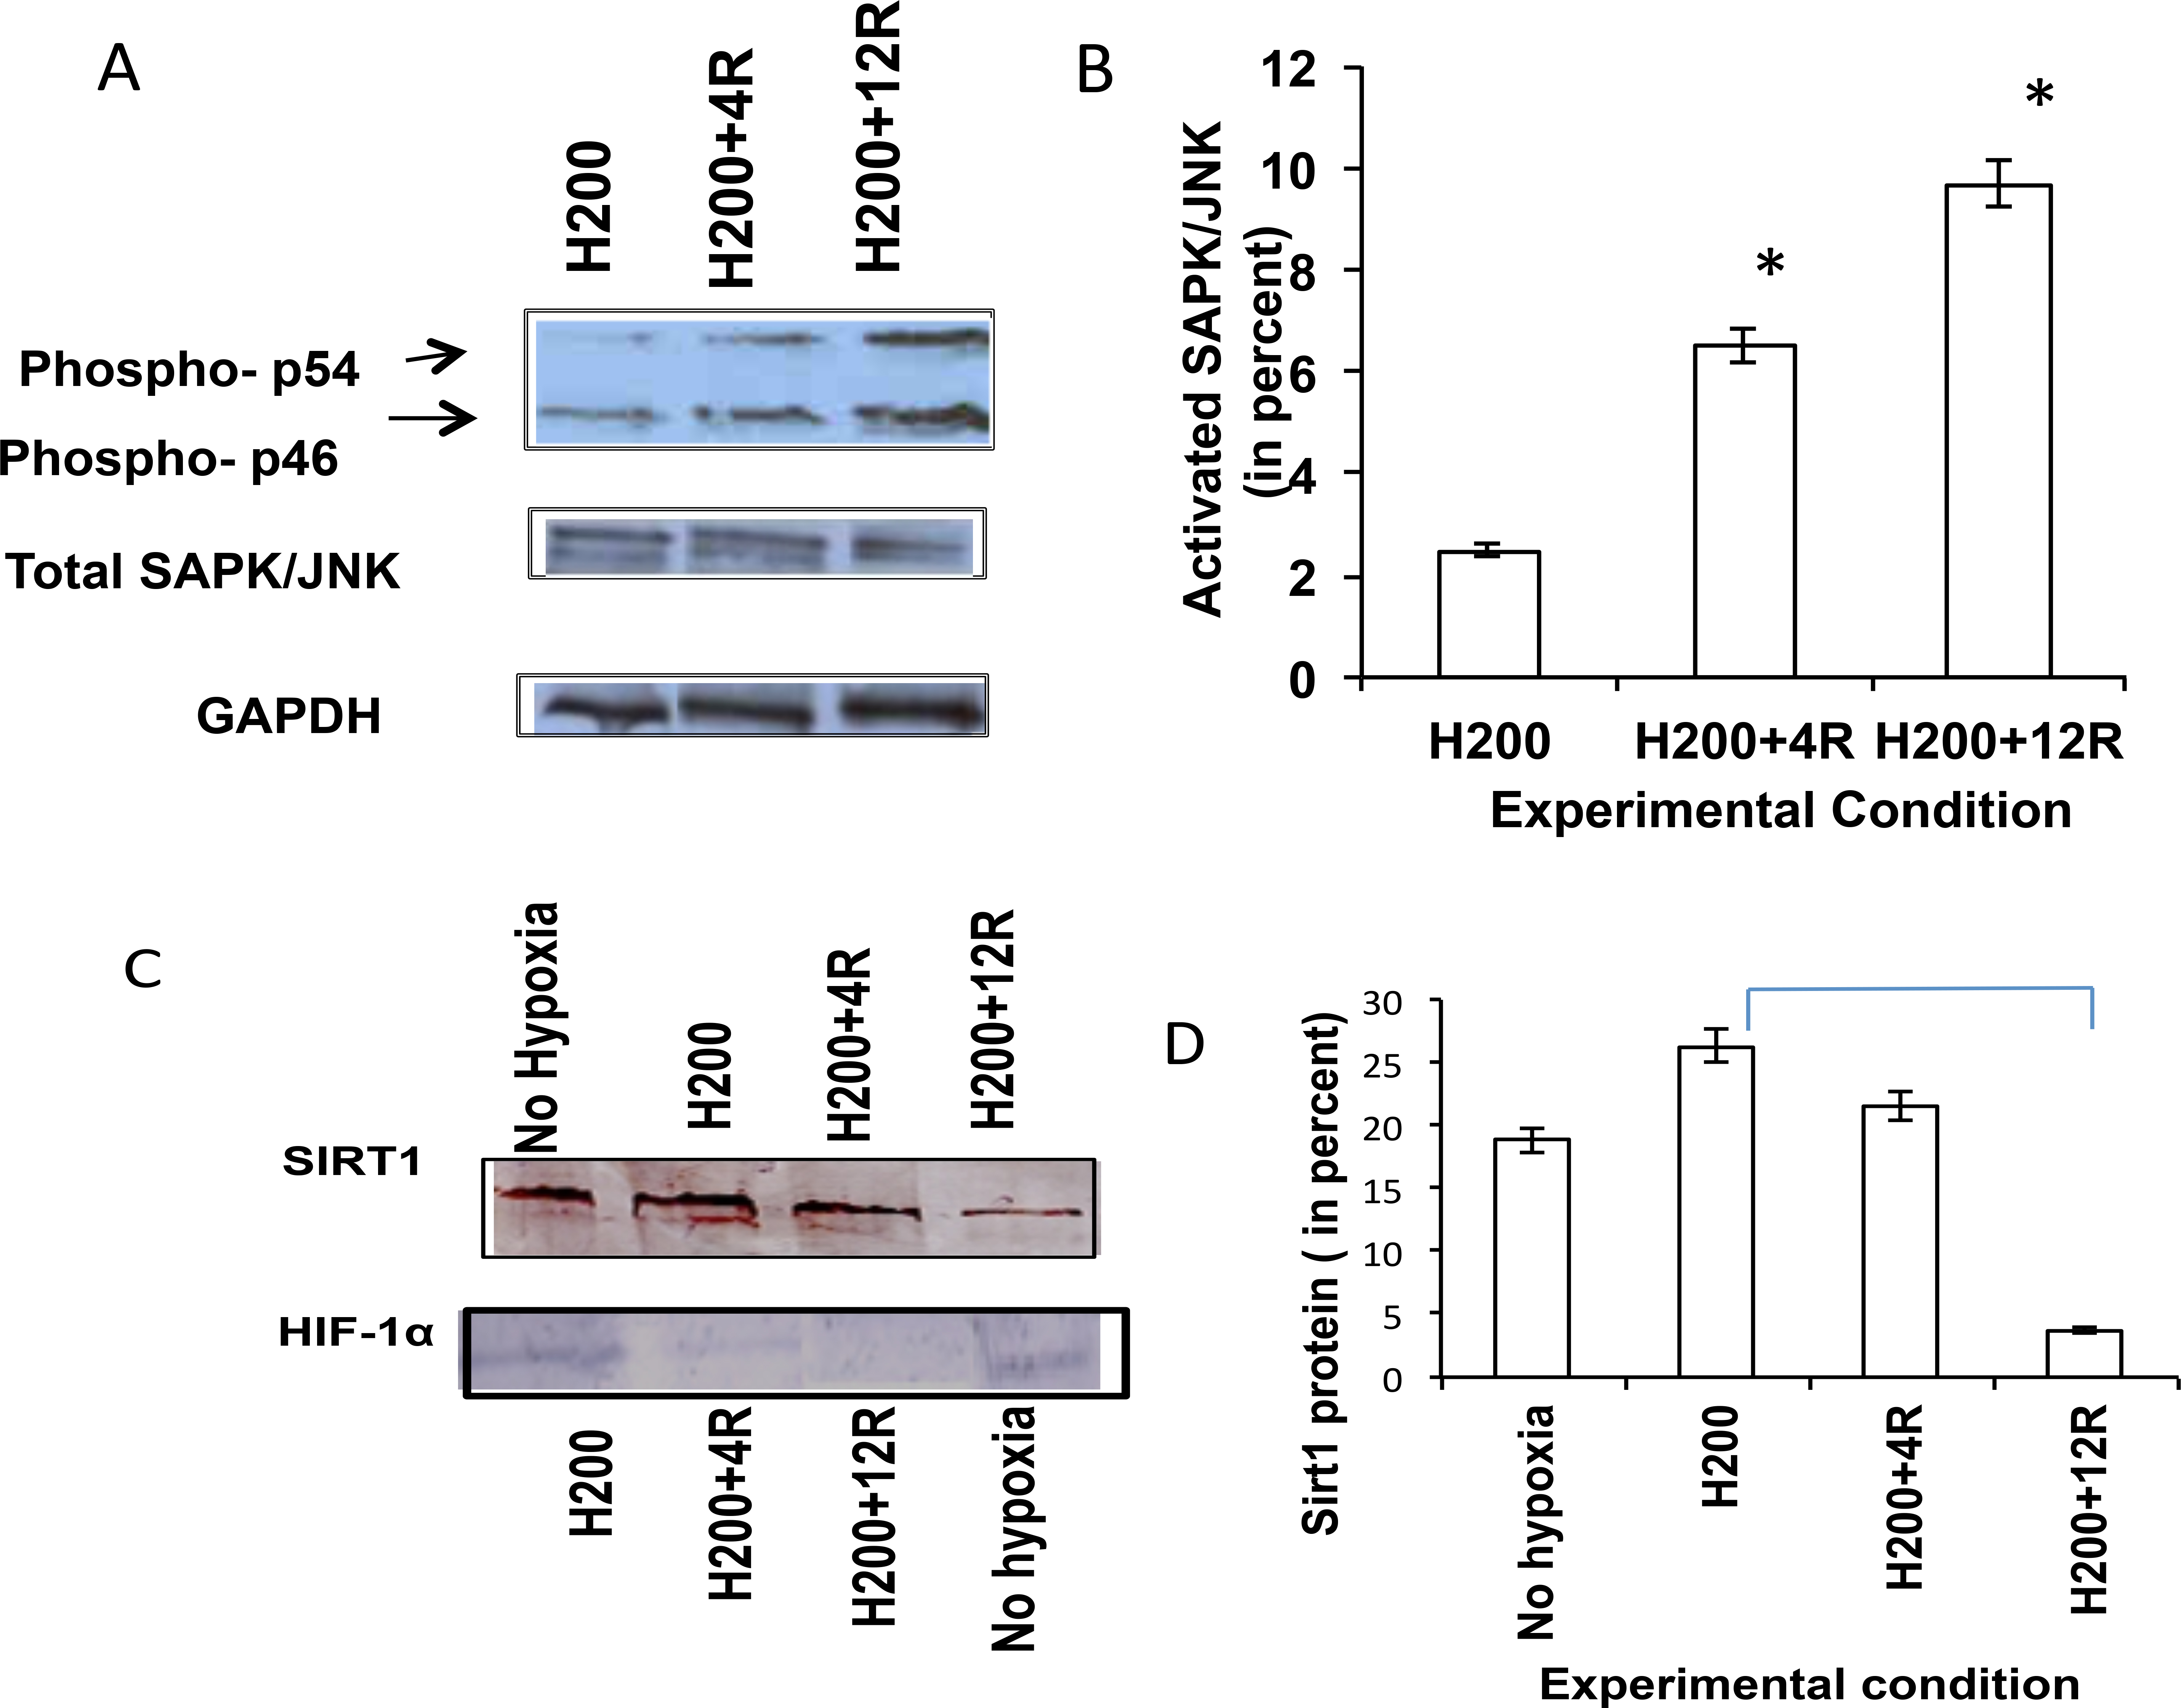
 Figure 3 of
Balaiya, Mol Vis 2013; 19:2385-2392.
Figure 3 of
Balaiya, Mol Vis 2013; 19:2385-2392.