Figure 4. Flash electroretinogram wave amplitudes in wild-type and hypoxia-inducible factor-1α retinal ganglion cell-knockout mice.
Amplitudes of a-waves (filled bars) and b-waves (shaded bars) of resting scotopic flash electroretinograms measured in wild-type
(WT; left; n=8) and hypoxia-inducible factor-1α retinal ganglion cell-knockout (HIF-1α RGC-KO; right; n=8) mice are shown. Means±standard error of the mean (SEM).
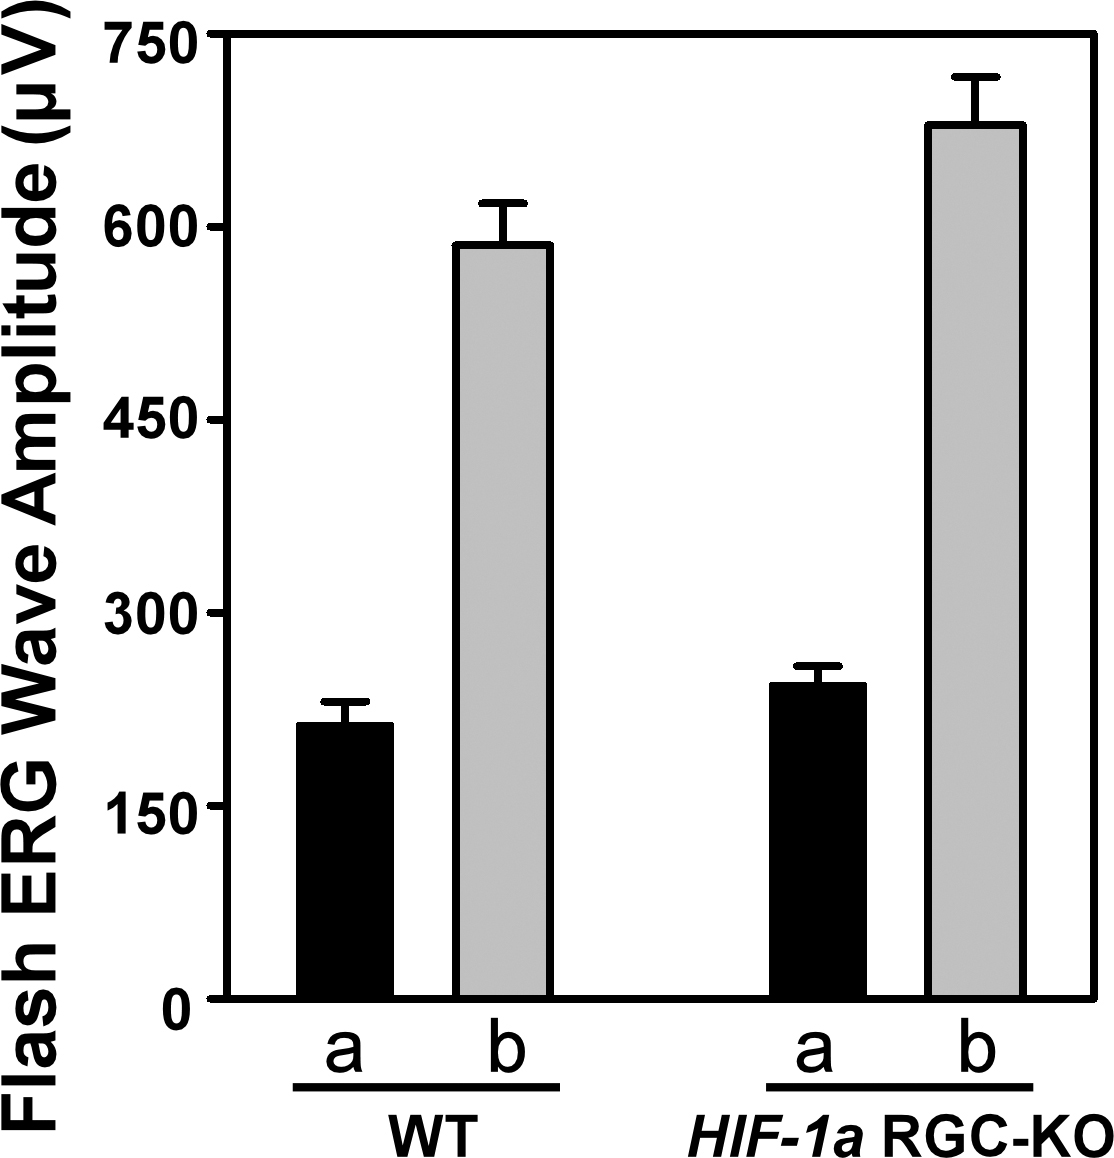
 Figure 4 of
Zhu, Mol Vis 2013; 19:2360-2372.
Figure 4 of
Zhu, Mol Vis 2013; 19:2360-2372.