Figure 3. Hematoxylin and eosin–stained cross sections of retinas from wild-type and hypoxia-inducible factor-1α retinal ganglion cell-knockout
mice. No gross differences in cell body densities or layer thicknesses were noted between the two genotypes across the retina,
as exemplified by these two representative images (n=3 each) from the mid-central retina from the wild-type (WT; left) and
hypoxia-inducible factor-1α retinal ganglion cell-knockout (HIF-1α RGC-KO; right) mice. Scale bar=50 µm.
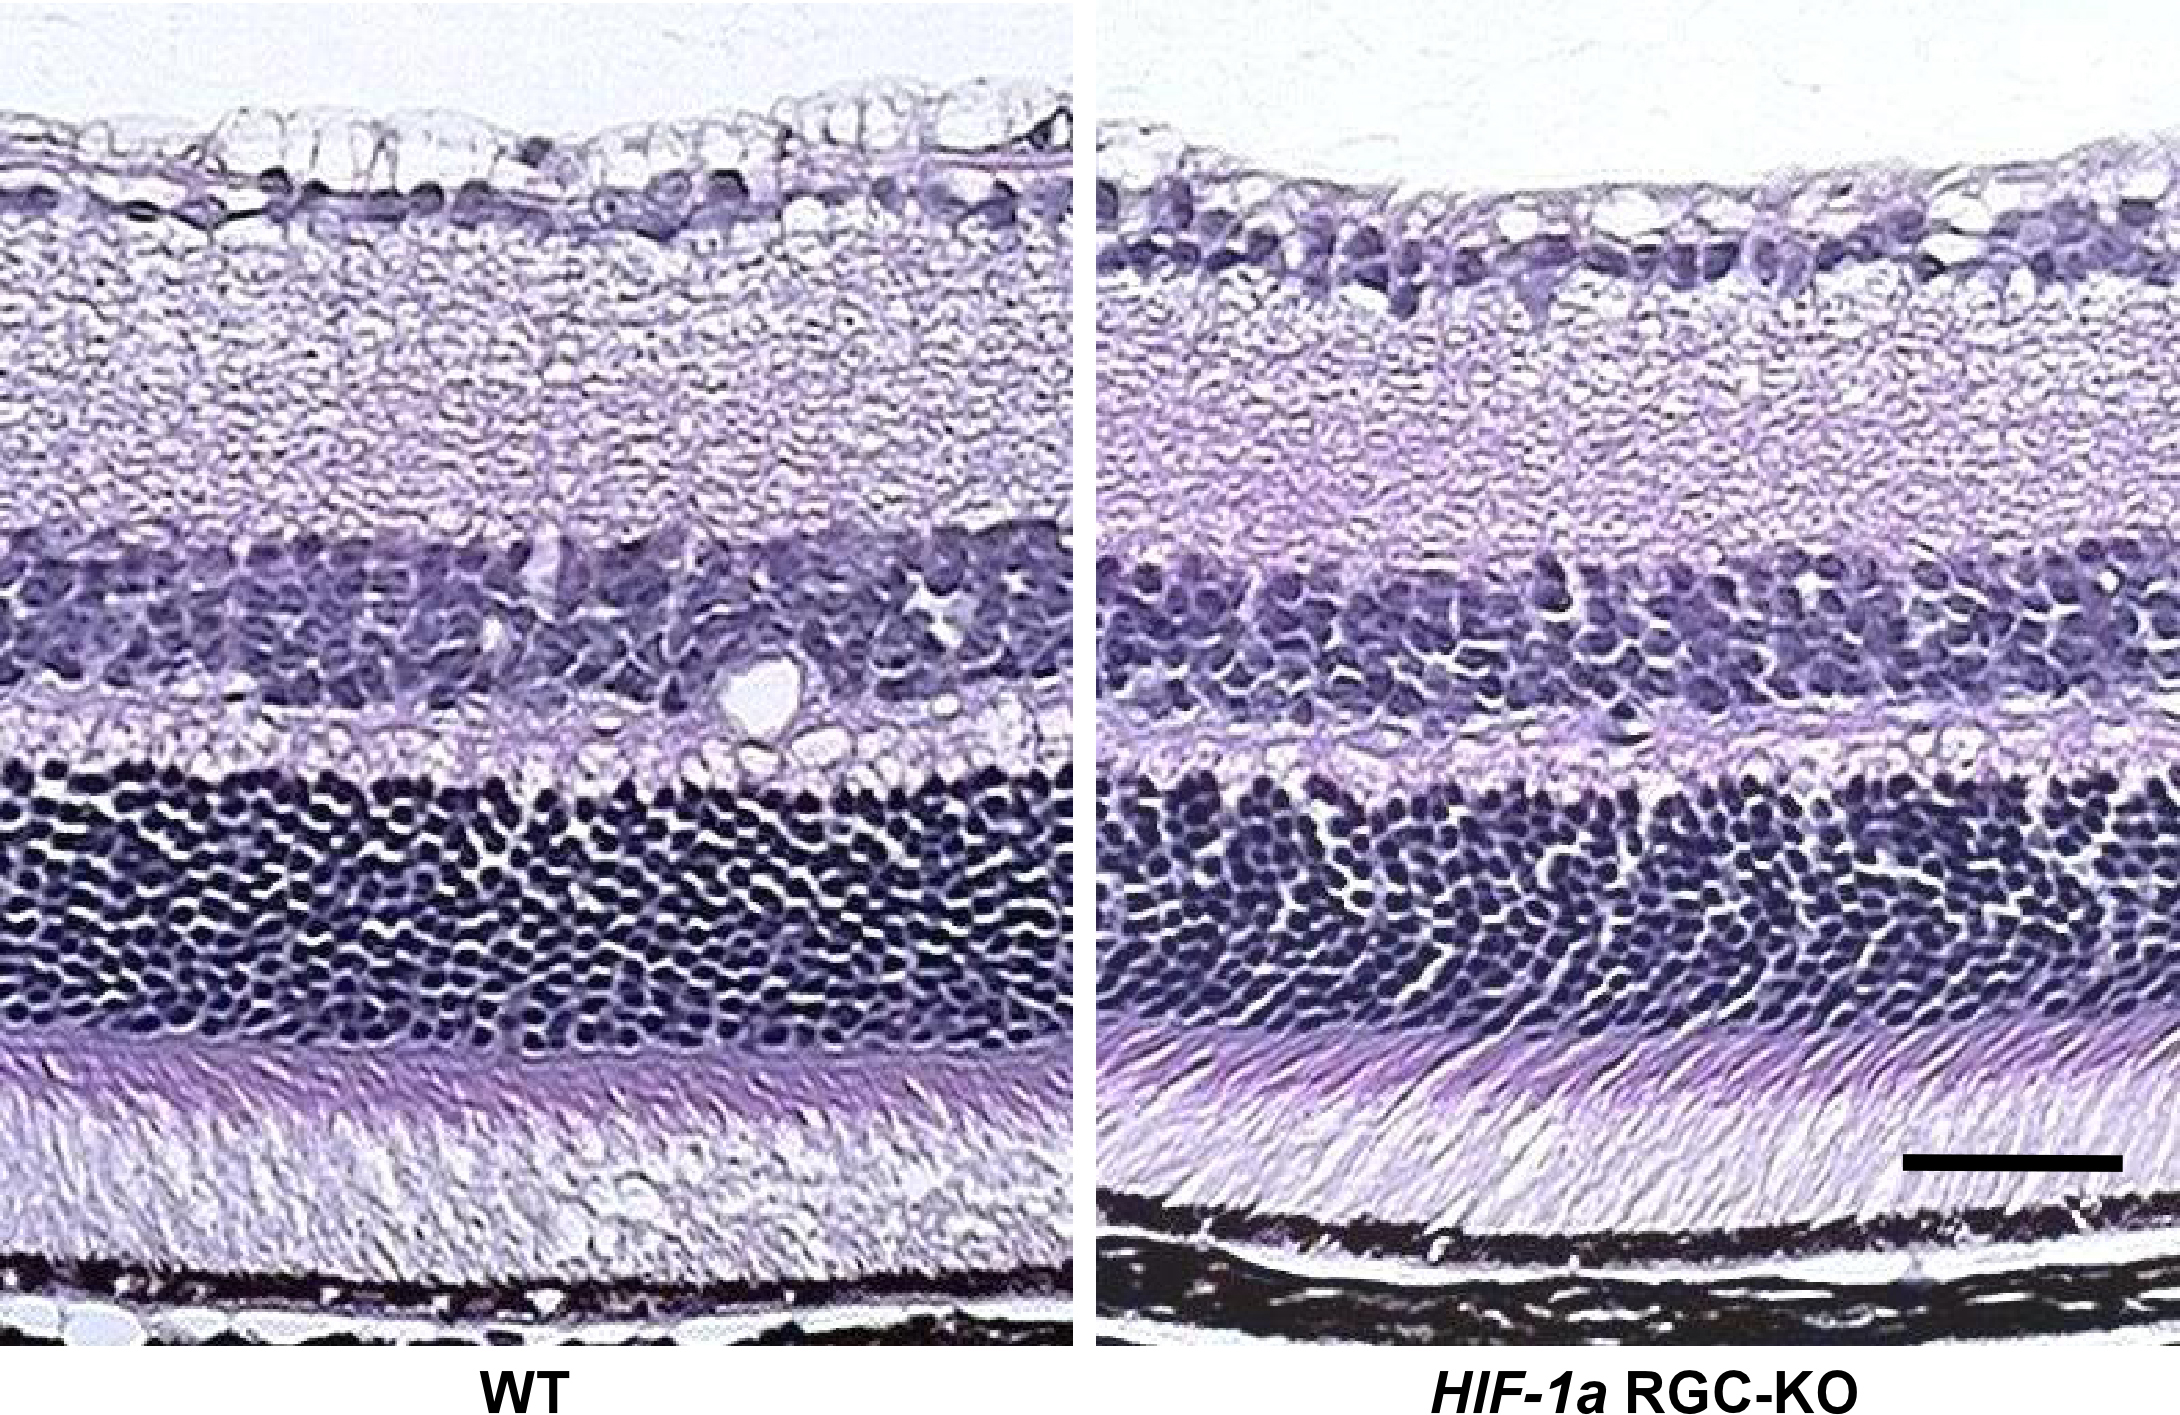
 Figure 3 of
Zhu, Mol Vis 2013; 19:2360-2372.
Figure 3 of
Zhu, Mol Vis 2013; 19:2360-2372.