Figure 2. Hypoxia-inducible factor-1α (HIF-1α) immunohistochemistry in normoxic and hypoxic wild-type and HIF-1α retinal ganglion cell-knockout
mice. HIF-1α expression is shown in representative wild-type (WT; A, B) and HIF-1α retinal ganglion cell-knockout (RGC-KO) mice (C, D) under normoxic (A, C) and hypoxic (B, D) conditions. The HIF-1α (green), brn3 (red), 4',6-diamidino-2-phenylindole dihydrochloride (DAPI; blue), and “merged” images
are shown in each row, left to right. In the images from the WT mice (A, B), arrowheads identify examples of HIF-1α and brn3 copositive RGCs in the ganglion cell layer (inset in the merged image shows
one example at higher magnification), and arrows identify HIF-1α-positive but brn3-negative amacrine cells (or brn3-negative
RGCs) in the ganglion cell layer. In the images from the HIF-1α RGC-KO mice (C, D), arrowheads identify examples of HIF-1α-negative but brn3-positive RGCs in the ganglion cell layer (inset in the merged
image shows one example at higher magnification), and arrows identify HIF-1α-positive but brn3-negative amacrine cells in
the ganglion cell layer. Scale bar=20 µm.
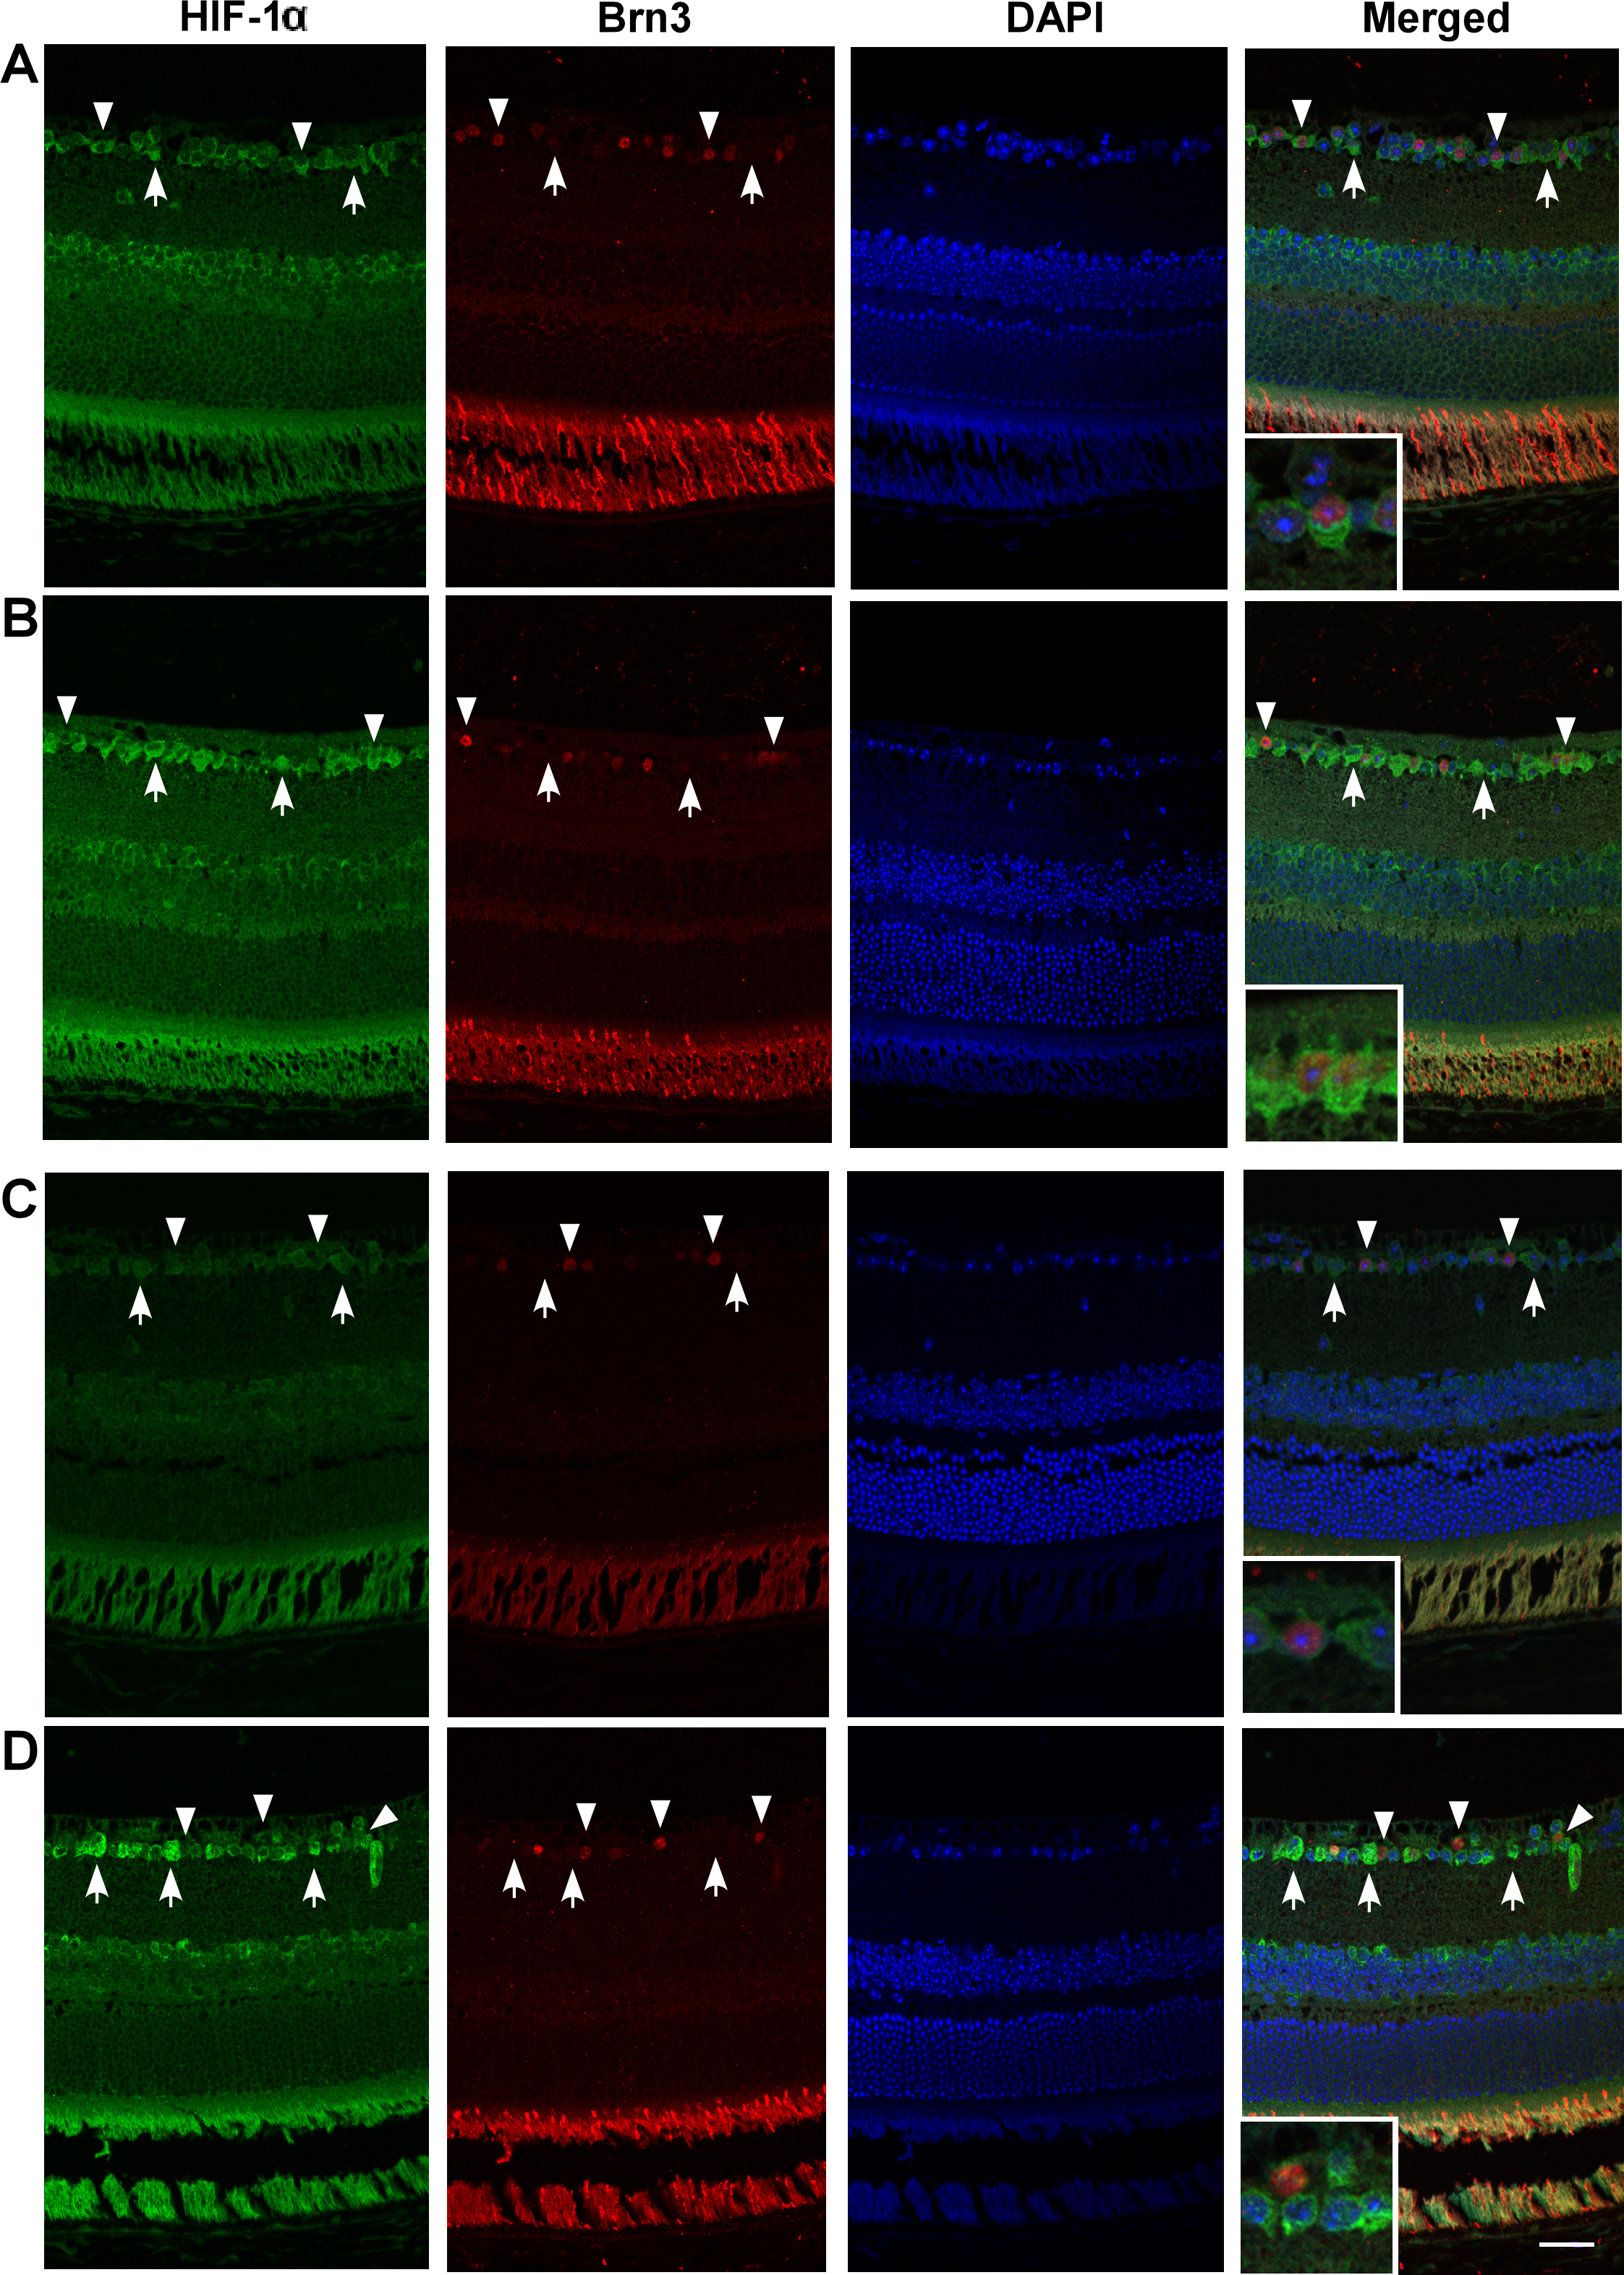
 Figure 2 of
Zhu, Mol Vis 2013; 19:2360-2372.
Figure 2 of
Zhu, Mol Vis 2013; 19:2360-2372.