Figure 2. The percentage changes in the dimensions of the specimens following fixation and storage are shown as box-whisker plots. A: Changes in thickness expressed in box-whisker plots for donor lenses (red) and extracted nuclei (blue). B: Changes in diameter expressed as box-whisker plots for donor lenses (red) and extracted nuclei (blue).
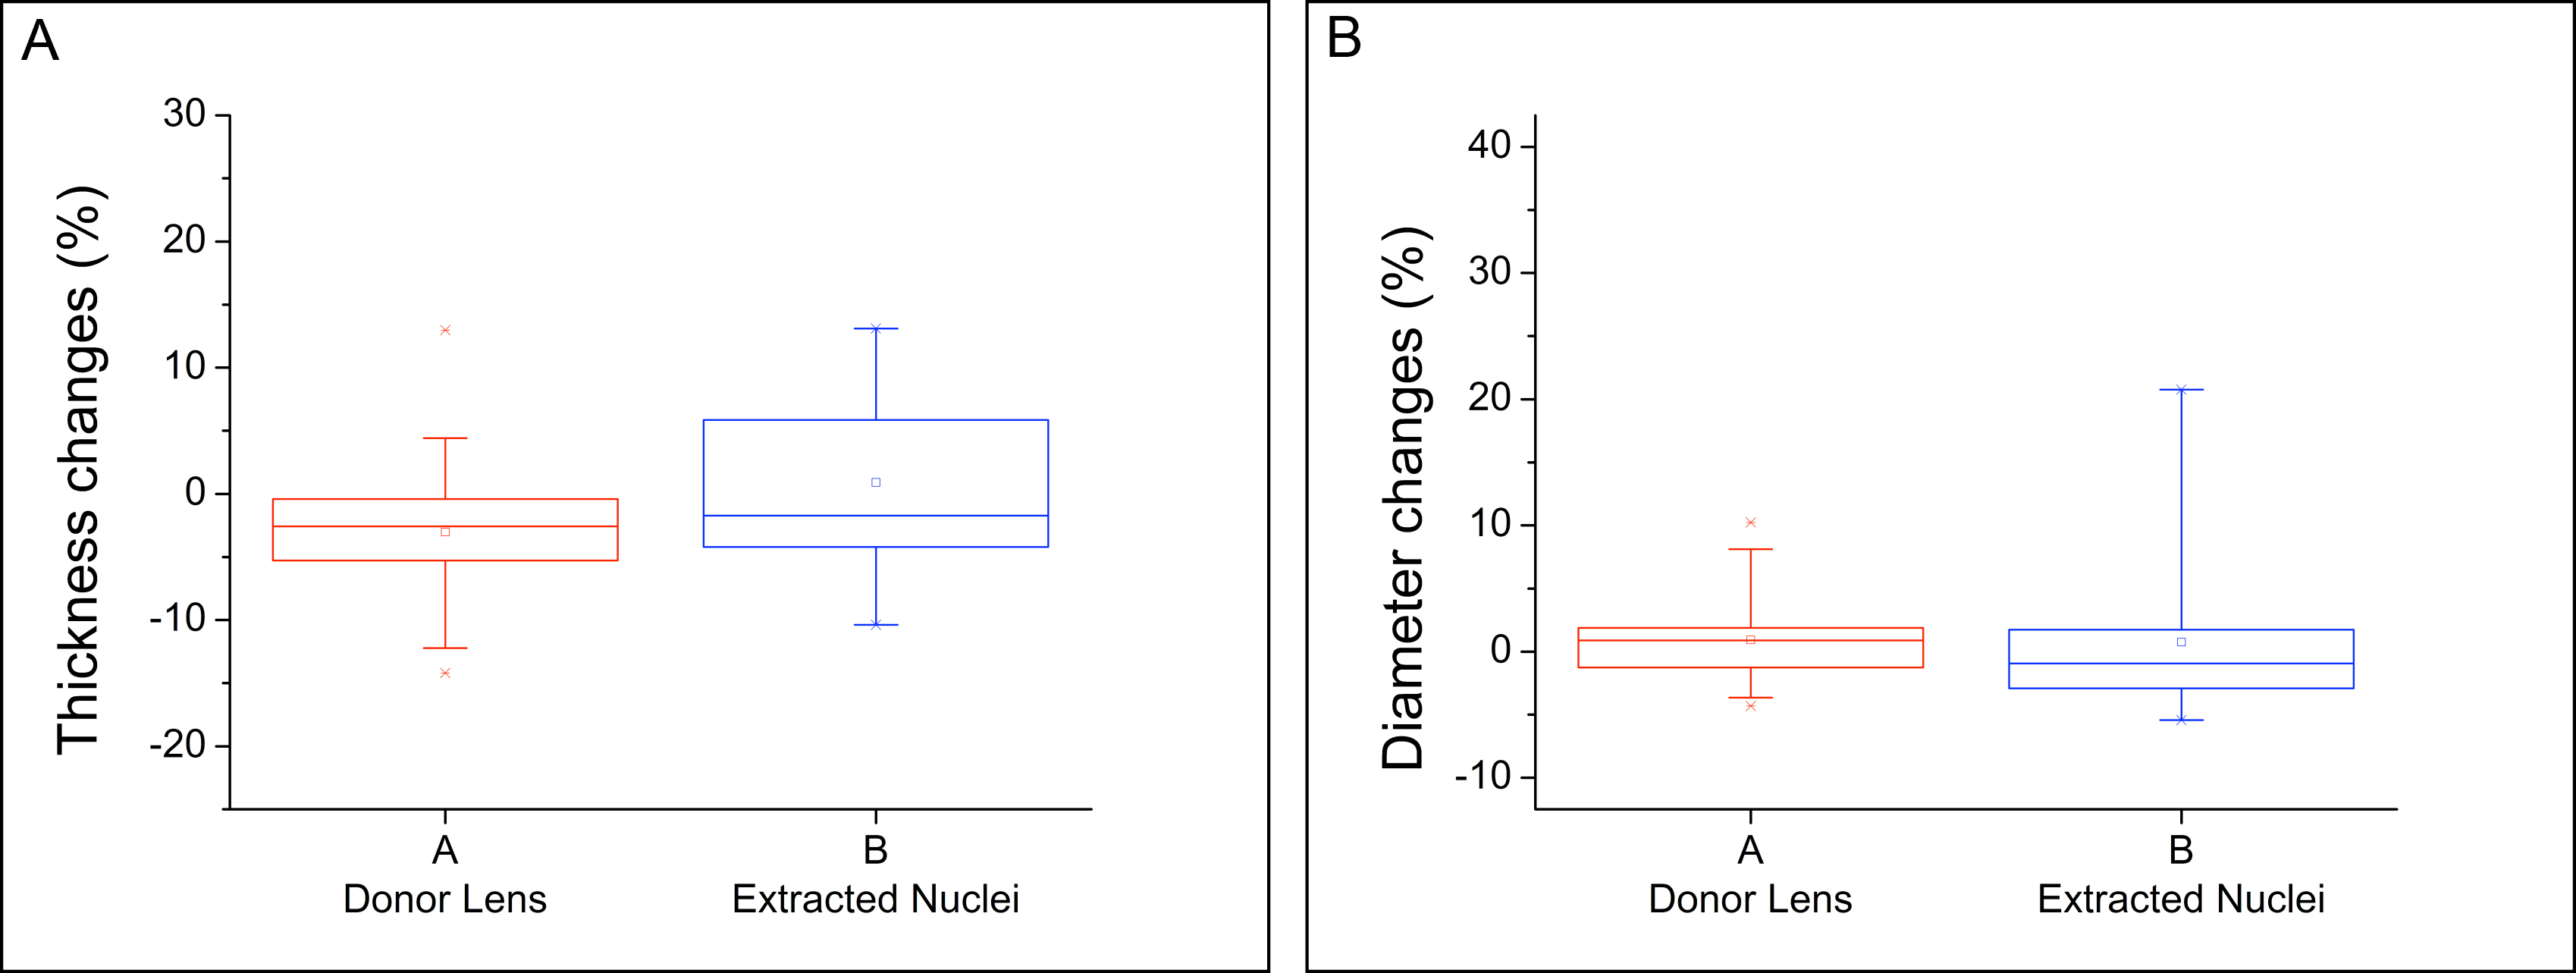
 Figure 2 of
Mohamed, Mol Vis 2013; 19:2352-2359.
Figure 2 of
Mohamed, Mol Vis 2013; 19:2352-2359.