Figure 1. In-depth single-nucleotide polymorphism analysis of the FGF10 region. The upper panel shows the distribution of association results of single-nucleotide polymorphisms (SNPs) across FGF10. Genotyped SNPs are indicated by a red circle, and imputed SNPs are indicated by a blue circle. The lower panel shows the
linkage disequilibrium structure in FGF10. Higher D’ values are indicated by a brighter red.
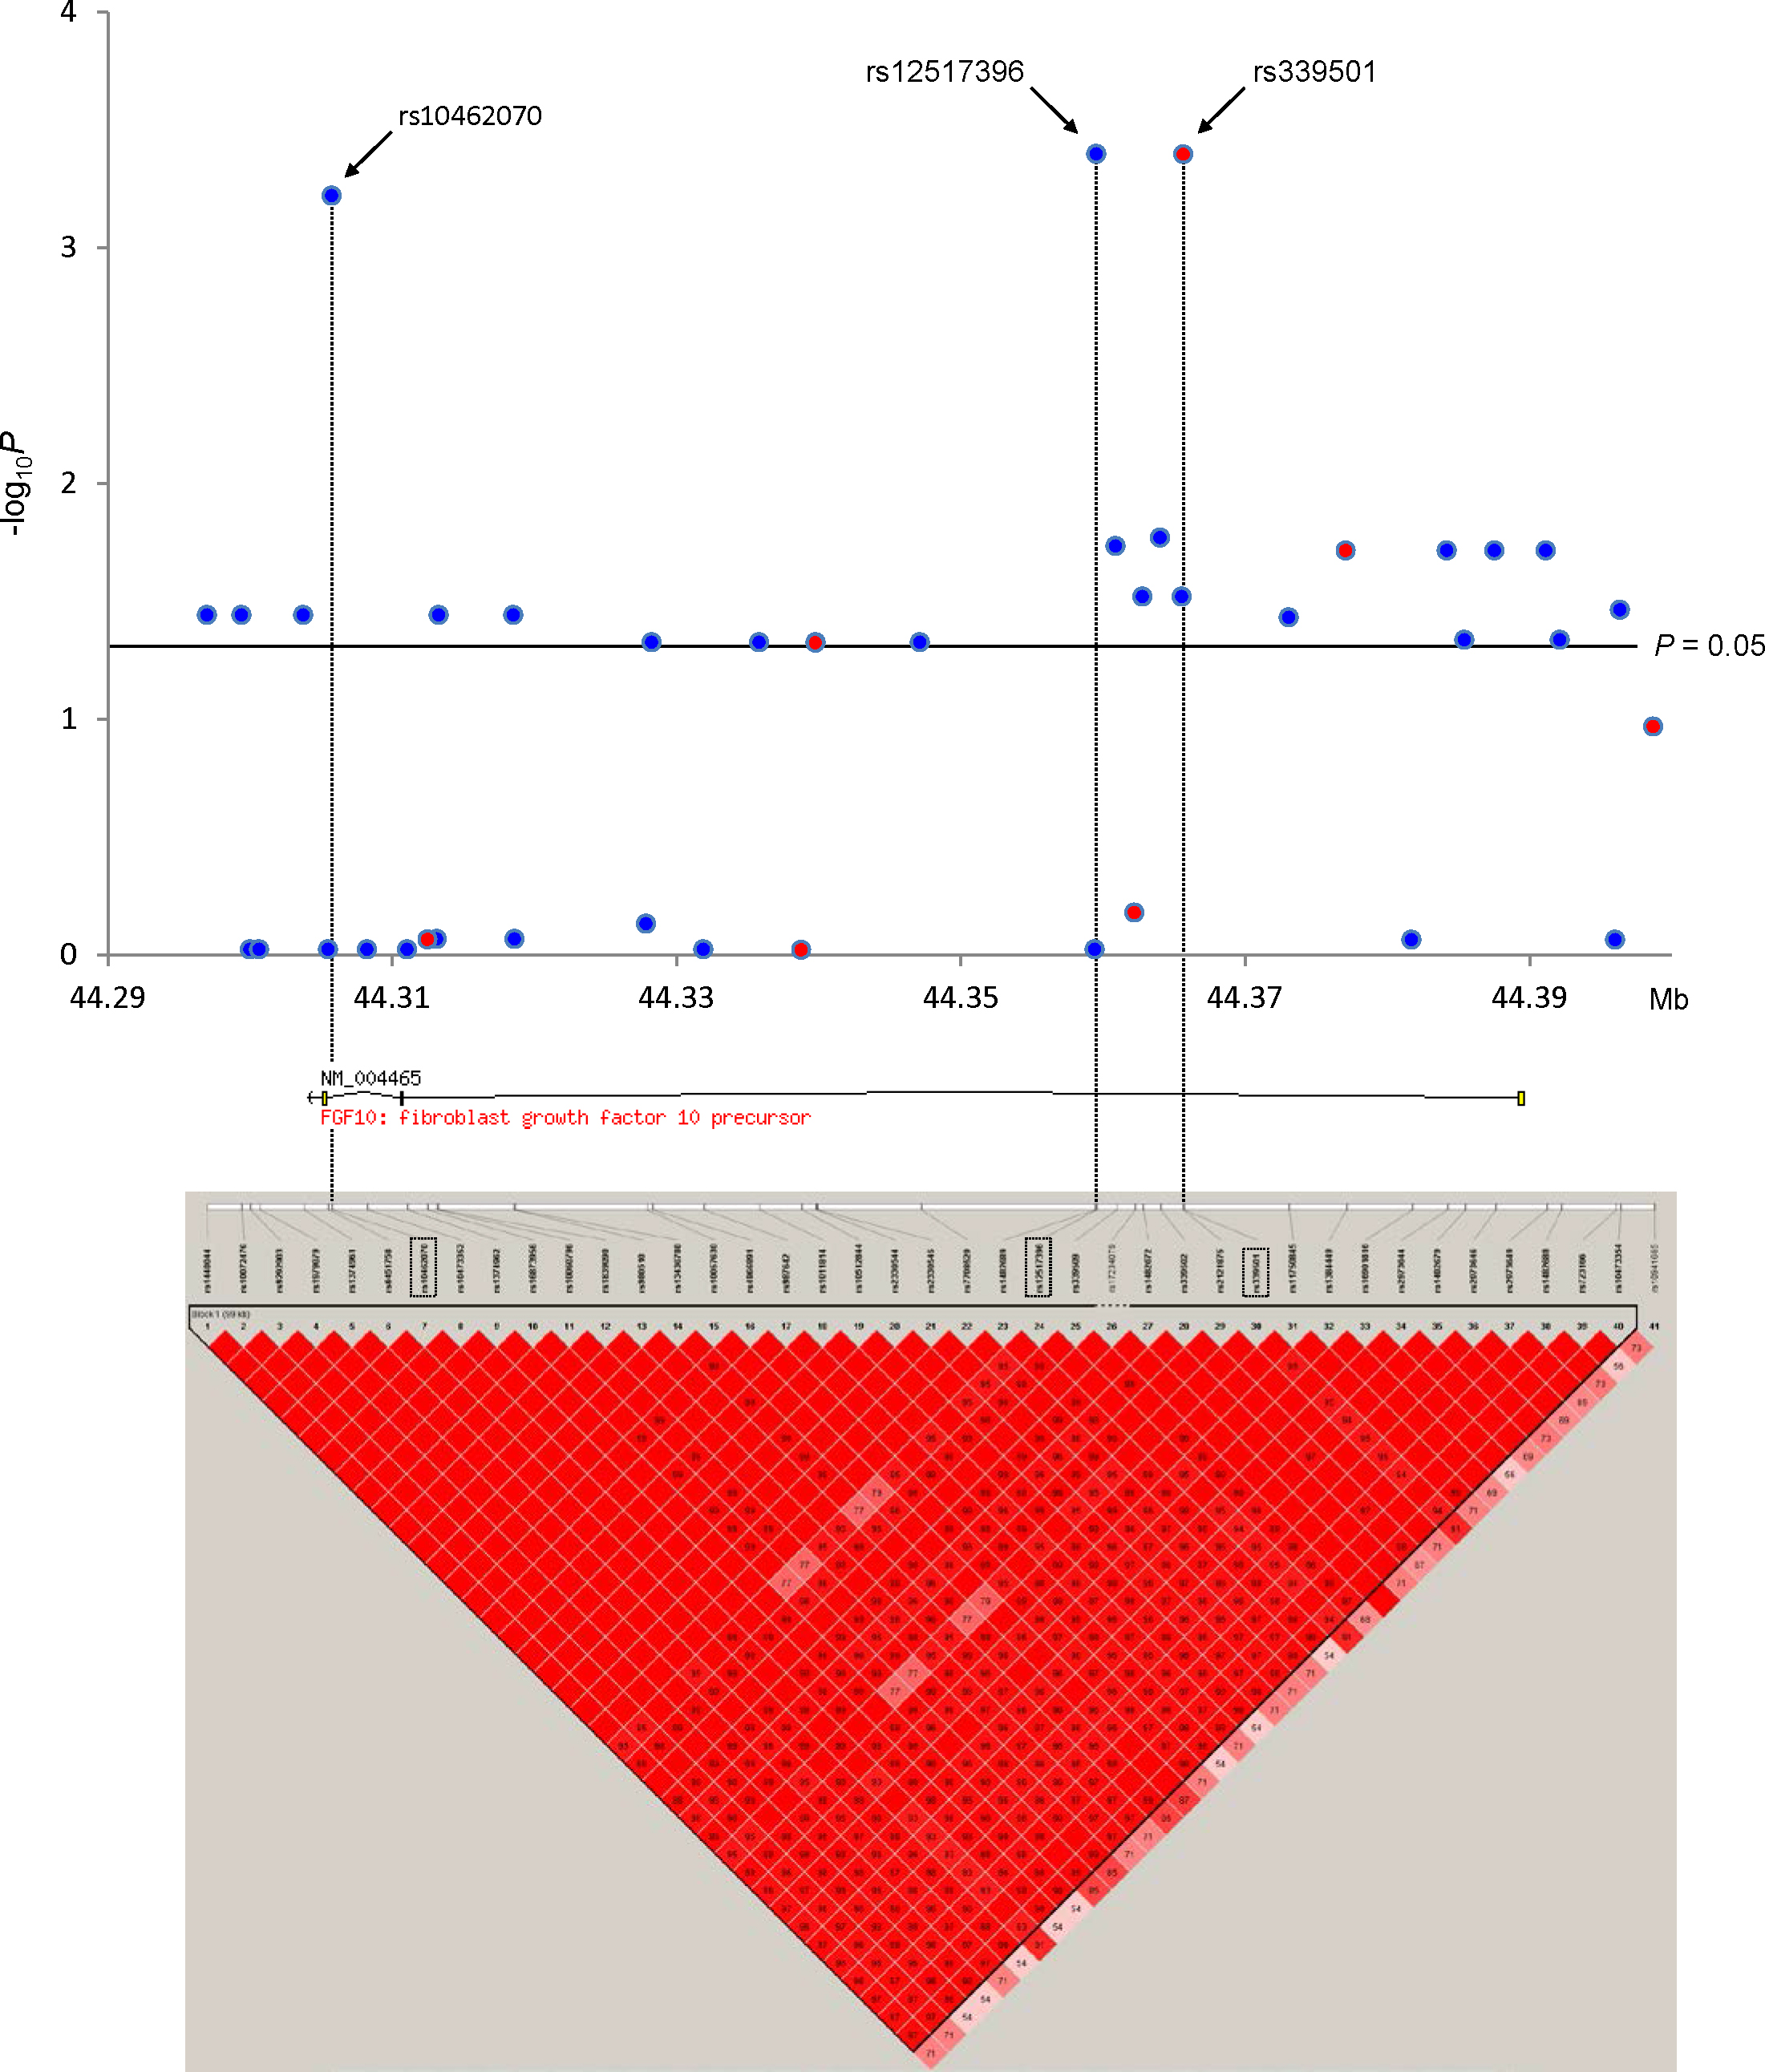
 Figure 1 of
Yoshida, Mol Vis 2013; 19:2321-2329.
Figure 1 of
Yoshida, Mol Vis 2013; 19:2321-2329.