Figure 7 of
Whitmore, Mol Vis 2013; 19:2274-2297.
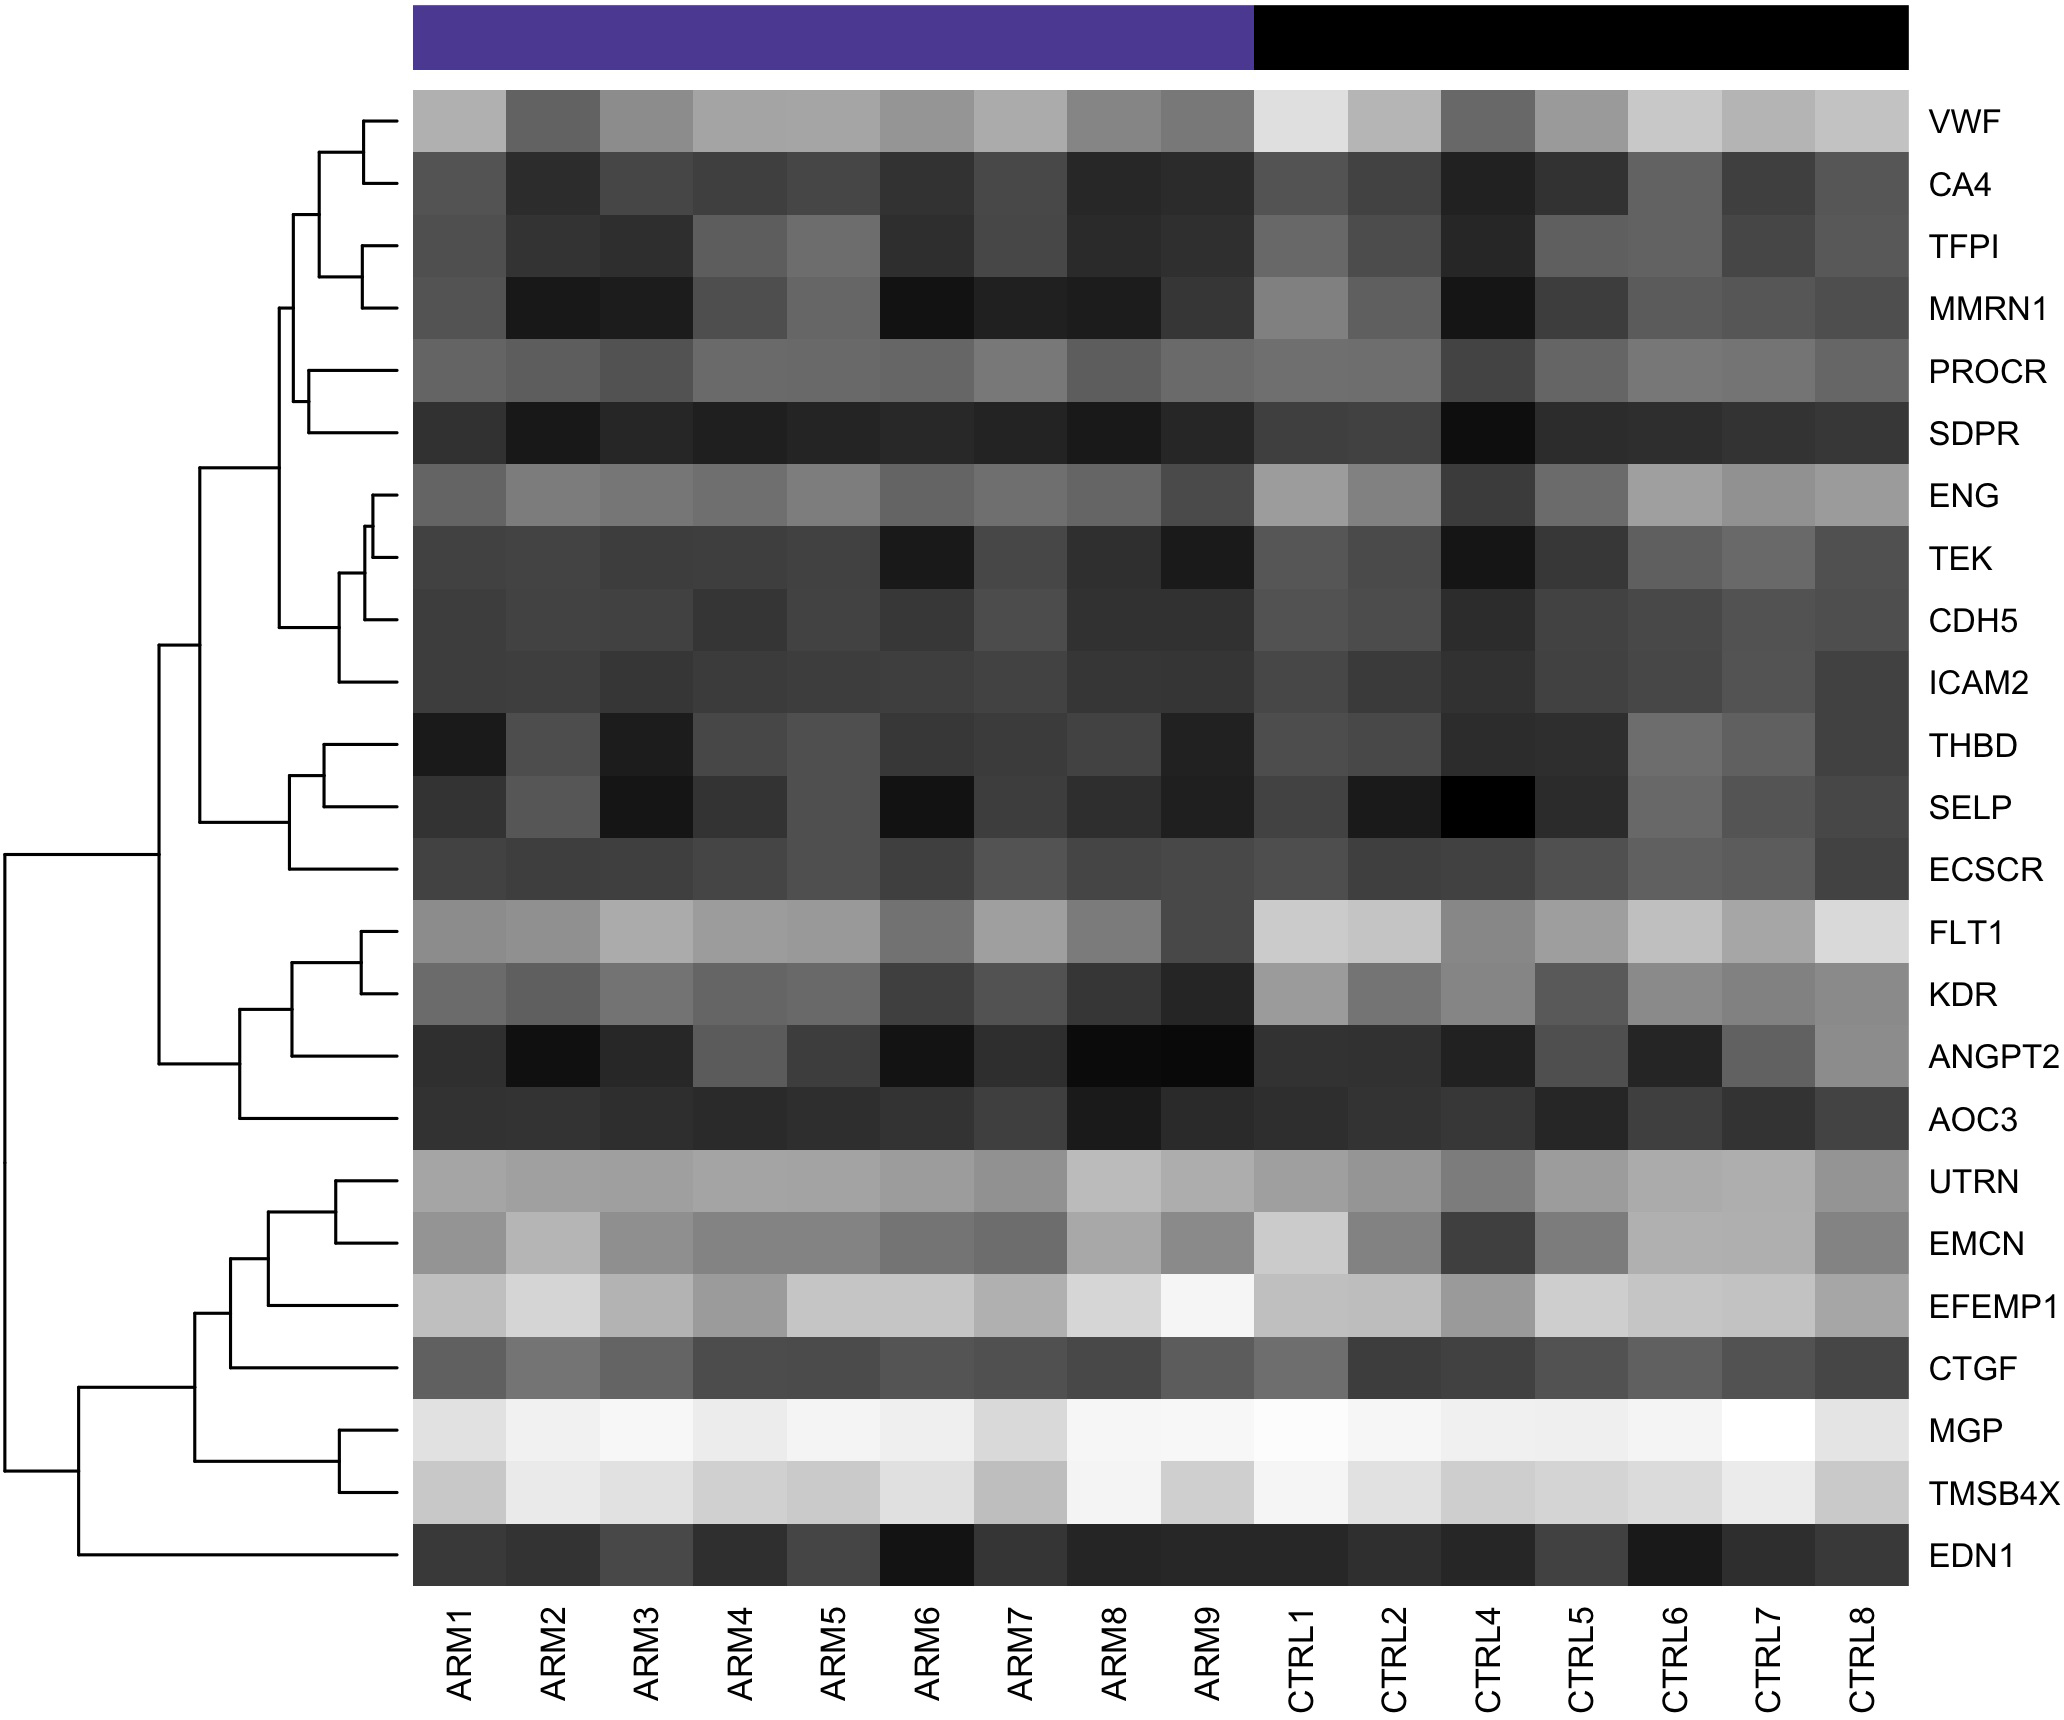
Figure 7.
Heatmap of genes associated with endothelial cells. Note the trend toward decreased expression in the AMD samples (ARM 1–9). Dark shading indicates low expression; light shading indicates high expression.
 Figure 7 of
Whitmore, Mol Vis 2013; 19:2274-2297.
Figure 7 of
Whitmore, Mol Vis 2013; 19:2274-2297.