Figure 7. YC-1 reduced cell survival under physical hypoxia. A: 661W cells were exposed to 0.066% DMSO or 20 μM YC-1 for 24 h under normoxia or hypoxia (0.5% O2, 5% CO2). Morphological changes in cell density were observed with light microscopy. Panel (B) is the quantified cell viability determined with an MTT assay (n=4). Panel (C) shows a concentration-dependent cell survival curve of YC-1 during hypoxia (n=4). 661W cells were incubated with 5, 10,
20, and 40 μM YC-1 for 5 min, followed by exposure to physical hypoxia for 24 h. * Indicates p<0.05 compared to the control
group or the DMSO vehicle group; # indicates p<0.05 compared to the hypoxic group.
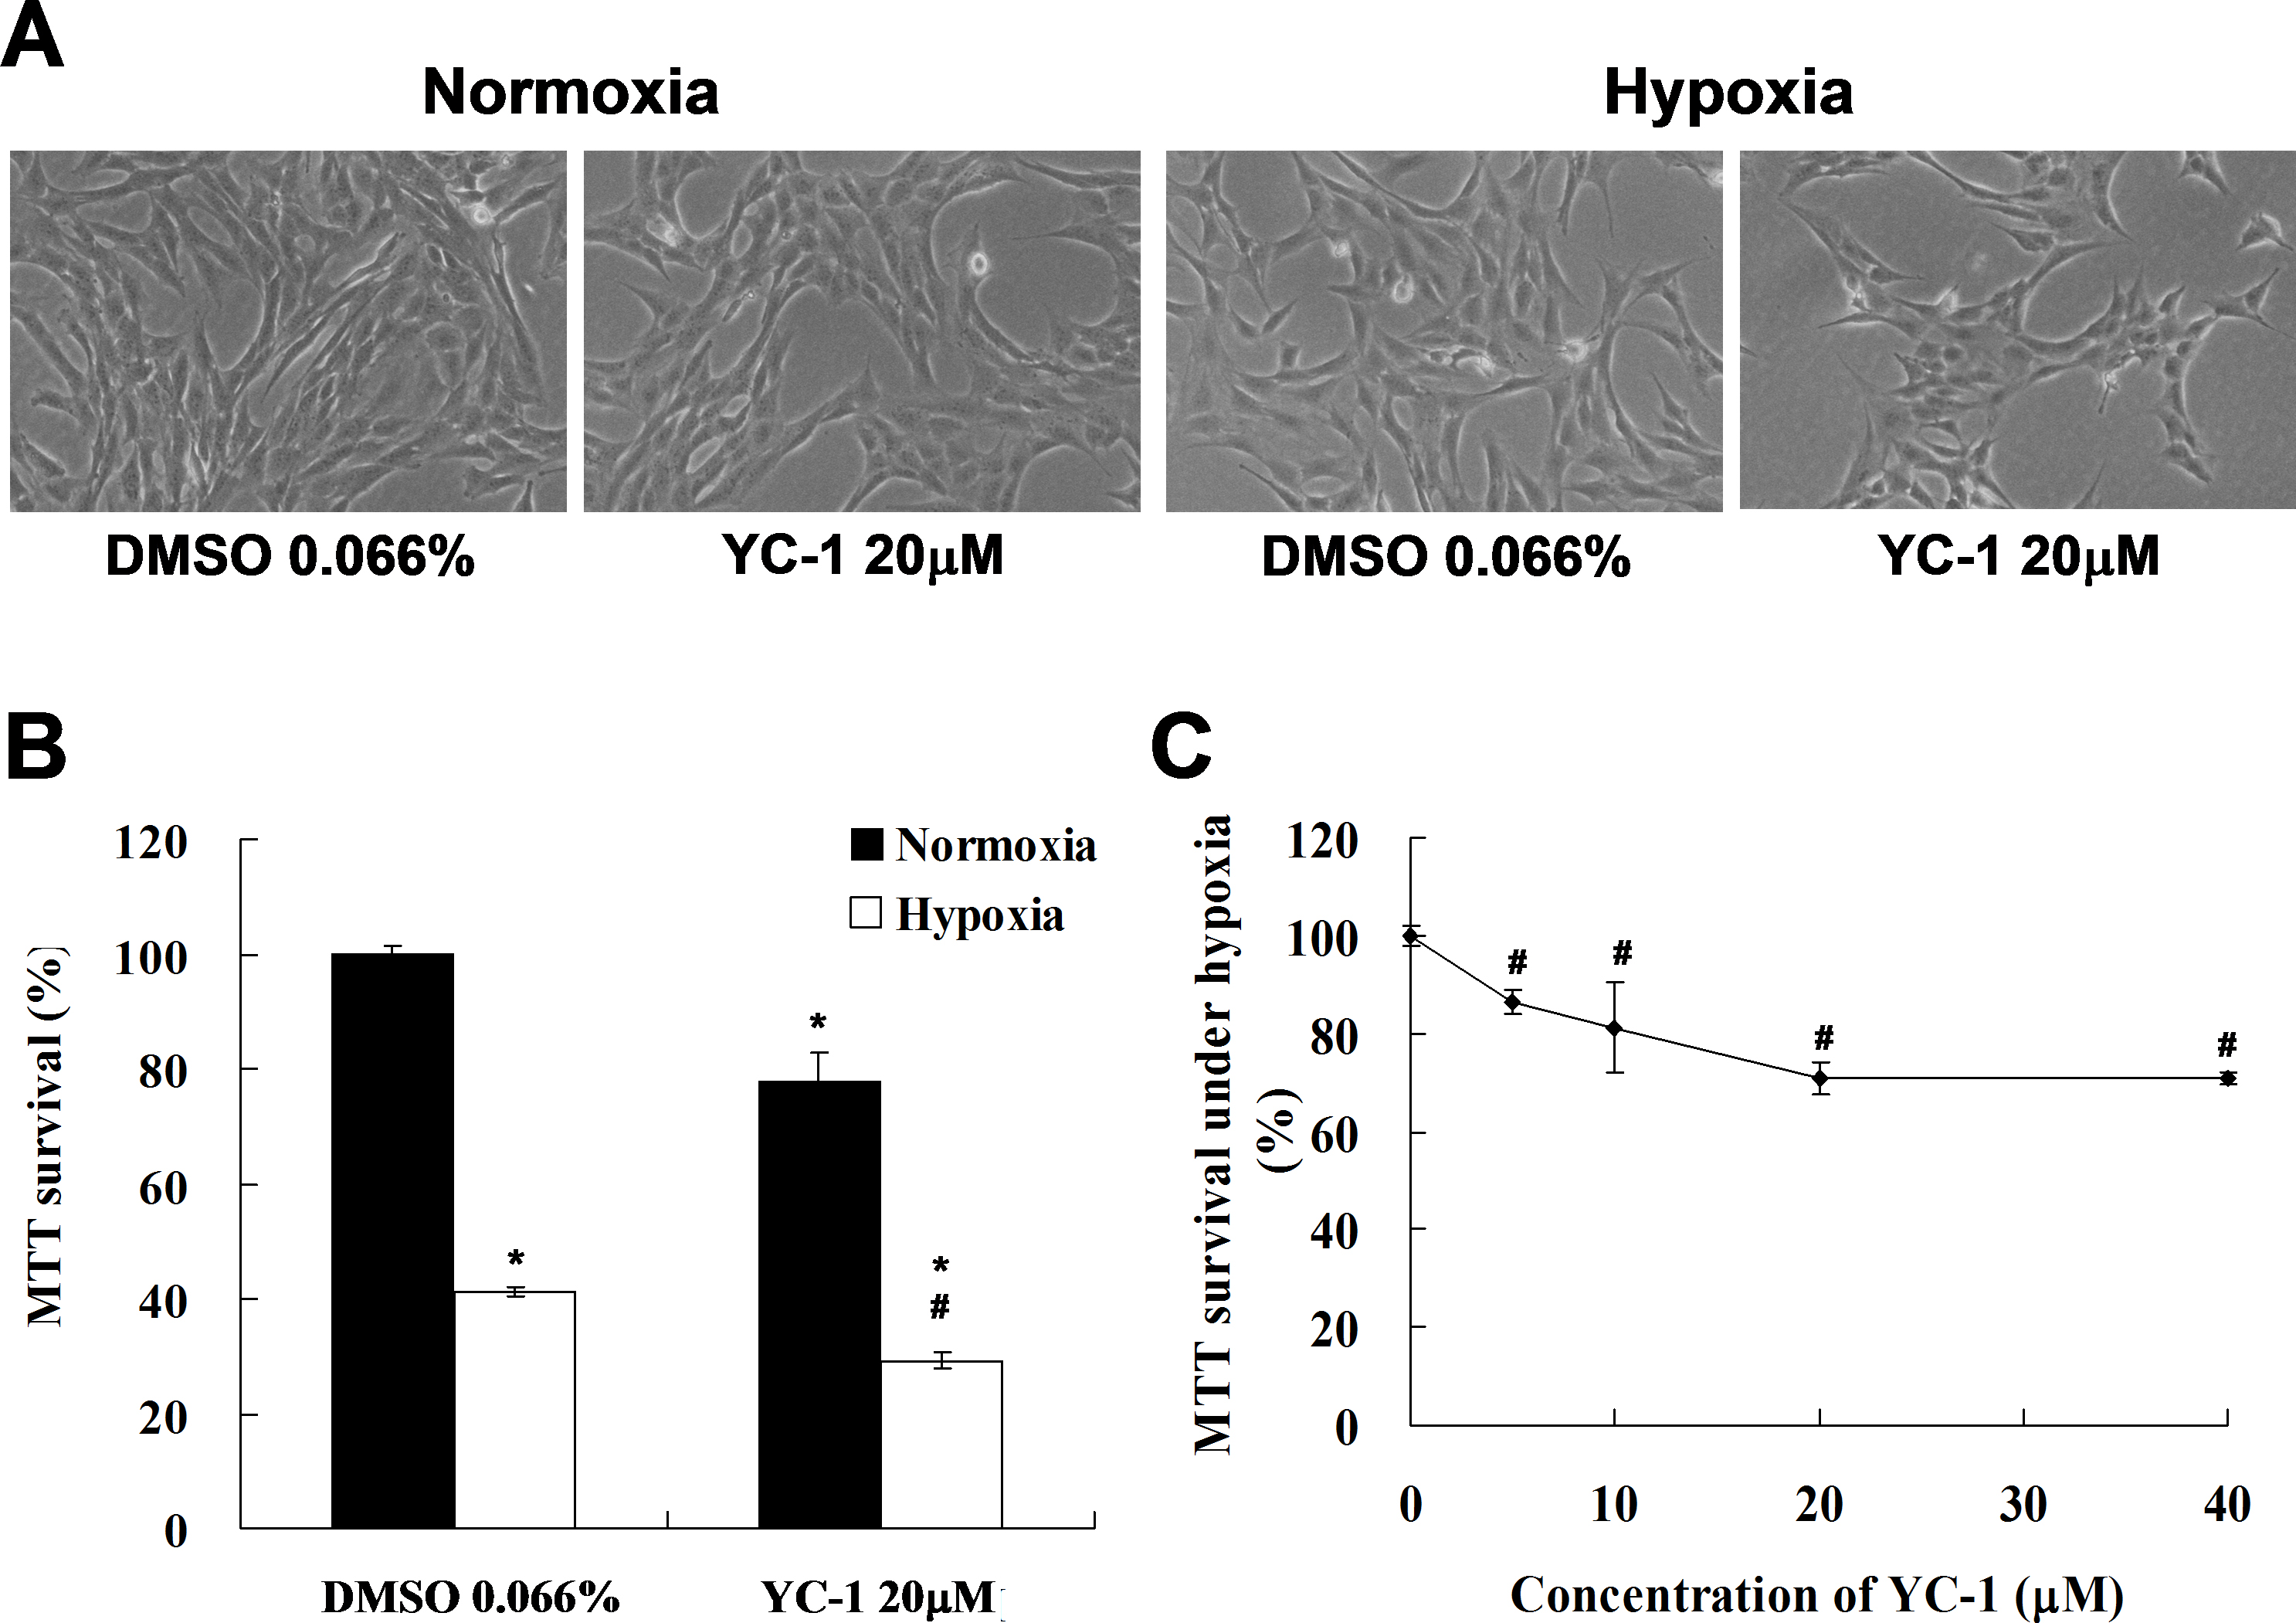
 Figure 7 of
Tsui, Mol Vis 2013; 19:2260-2273.
Figure 7 of
Tsui, Mol Vis 2013; 19:2260-2273.